
Novogene Korea
  • Novogene Korea
  • Genomics
    • Human Whole Genome Sequencing
    • Plant & Animal Whole Genome Sequencing
    • Microbial Whole Genome Sequencing
    • Whole Exome Sequencing
    • Plant & Animal De novo Sequencing
    • Microbial De novo Sequencing
    • Amplicon Sequencing
    • Shotgun Metagenomics Sequencing
    Transcriptomics
    • mRNA Sequencing
    • Total RNA Sequencing
    • Full-Length Transcriptome Sequencing
    • Whole Transcriptome Sequencing
    • Small RNA Sequencing
    • Circular RNA Sequencing
    • Metatranscriptome Sequencing
    • Prokaryotic RNA Sequencing
    Single Cell & Spatial Omics
    • Single Cell Gene Expression
    • Single Cell Immune Profiling Sequencing
    • Single Cell Long Read Transcriptome
    • Visium HD Spatial Gene Expression
    • Stereo-Seq Spatial Gene Expression
    • Xenium In Situ Spatial Transcriptome
    Epigenomics
    • Whole Genome Bisulfite Sequencing (WGBS)
    • Directed DNA Methylation Sequencing (DM-Seq) NEW
    • Reduced Representation Bisulfite Sequencing (RRBS)
    • Chromatin Immunoprecipitation Sequencing (ChIP-seq)
    • RNA Immunoprecipitation Sequencing (RIP-seq)
    • Assay for Transposase-Accessible Chromatin with Sequencing (ATAC-seq)

    Premade Library

    • Sequencing Only (Illumina 플랫폼)
    • Sequencing Only (PacBio 플랫폼)
    Proteomics & Metabolomics
    • Olink Proteomics
    • Quantitative Proteomics (MS)
    • Untargeted Metabolomics (MS)
  • 프로모션프로모션
    • 플랫폼
    • 자동화 운송 플랫폼 (Falcon)
    • BI 분석툴 (NovoMagic)
    • Customer Service System (CSS)
    • 브로셔
    • 케이스 스터디
    • 웨비나
    • 블로그
    • 샘플준비 가이드라인
    • 커뮤니티
    • 암 연구
    • 면역 종양학
    • 농업
    • 환경
    • 식품
    • 인간 마이크로바이옴
    • 동물 & 식물 마이크로바이옴
    • 신약개발
    • 희귀 질환 연구
    • 회사소개
    • 글로벌 입지
    • 뉴스룸
    • 채용 정보
  • 문의하기문의하기

서비스서비스 menu

고객지원고객지원 menu

기업정보기업정보 menu

서비스
WGSDe novo SeqAmplicon SeqShotgun MetagenomeDM-SeqmRNA-SeqSingle Cell Gene ExpressionVisium HDXenium In SituOlinkUntargeted Metabolomics
고객지원
노보매직CSSFalcon 플랫폼
기업정보
회사소개글로벌 입지플랫폼뉴스룸채용 정보문의하기
LinkedInLinkedIn hoverYouTubeYouTube hoverXX hoverMetaMeta hoverInstagramInstagram hover
Copyright © 2026 Novogene Co., Ltd. All Rights Reserved. 노보진의 한국 내 모든 서비스는 연구 목적 (Research Use Only, RUO) 으로만 제공됩니다. 사업자등록번호: 494-86-03792 | 판매자번호: 노보진코리아유한회사 | 대표자명: 리휘시앙 | 사업자주소: 서울시 강서구 마곡동 779-1번지 뉴브클라우드힐스 BT-230, 231호, 07790 | 전화번호: 02-2038-8036
Novogene Korea
  • Novogene Korea
  • Genomics
    • Human Whole Genome Sequencing
    • Plant & Animal Whole Genome Sequencing
    • Microbial Whole Genome Sequencing
    • Whole Exome Sequencing
    • Plant & Animal De novo Sequencing
    • Microbial De novo Sequencing
    • Amplicon Sequencing
    • Shotgun Metagenomics Sequencing
    Transcriptomics
    • mRNA Sequencing
    • Total RNA Sequencing
    • Full-Length Transcriptome Sequencing
    • Whole Transcriptome Sequencing
    • Small RNA Sequencing
    • Circular RNA Sequencing
    • Metatranscriptome Sequencing
    • Prokaryotic RNA Sequencing
    Single Cell & Spatial Omics
    • Single Cell Gene Expression
    • Single Cell Immune Profiling Sequencing
    • Single Cell Long Read Transcriptome
    • Visium HD Spatial Gene Expression
    • Stereo-Seq Spatial Gene Expression
    • Xenium In Situ Spatial Transcriptome
    Epigenomics
    • Whole Genome Bisulfite Sequencing (WGBS)
    • Directed DNA Methylation Sequencing (DM-Seq) NEW
    • Reduced Representation Bisulfite Sequencing (RRBS)
    • Chromatin Immunoprecipitation Sequencing (ChIP-seq)
    • RNA Immunoprecipitation Sequencing (RIP-seq)
    • Assay for Transposase-Accessible Chromatin with Sequencing (ATAC-seq)

    Premade Library

    • Sequencing Only (Illumina 플랫폼)
    • Sequencing Only (PacBio 플랫폼)
    Proteomics & Metabolomics
    • Olink Proteomics
    • Quantitative Proteomics (MS)
    • Untargeted Metabolomics (MS)
  • 프로모션프로모션
    • 플랫폼
    • 자동화 운송 플랫폼 (Falcon)
    • BI 분석툴 (NovoMagic)
    • Customer Service System (CSS)
    • 브로셔
    • 케이스 스터디
    • 웨비나
    • 블로그
    • 샘플준비 가이드라인
    • 커뮤니티
    • 암 연구
    • 면역 종양학
    • 농업
    • 환경
    • 식품
    • 인간 마이크로바이옴
    • 동물 & 식물 마이크로바이옴
    • 신약개발
    • 희귀 질환 연구
    • 회사소개
    • 글로벌 입지
    • 뉴스룸
    • 채용 정보
  • 문의하기문의하기

서비스서비스 menu

고객지원고객지원 menu

기업정보기업정보 menu

서비스
WGSDe novo SeqAmplicon SeqShotgun MetagenomeDM-SeqmRNA-SeqSingle Cell Gene ExpressionVisium HDXenium In SituOlinkUntargeted Metabolomics
고객지원
노보매직CSSFalcon 플랫폼
기업정보
회사소개글로벌 입지플랫폼뉴스룸채용 정보문의하기
LinkedInLinkedIn hoverYouTubeYouTube hoverXX hoverMetaMeta hoverInstagramInstagram hover
Copyright © 2026 Novogene Co., Ltd. All Rights Reserved. 노보진의 한국 내 모든 서비스는 연구 목적 (Research Use Only, RUO) 으로만 제공됩니다. 사업자등록번호: 494-86-03792 | 판매자번호: 노보진코리아유한회사 | 대표자명: 리휘시앙 | 사업자주소: 서울시 강서구 마곡동 779-1번지 뉴브클라우드힐스 BT-230, 231호, 07790 | 전화번호: 02-2038-8036
banner laptop bg
banner mobile bg

Plant & Animal De novo 시퀀싱

복잡한 유전체와 종 특이적 유전체 특성을 정확하게 규명할 수 있도록 식물 및 동물 유전체를 De novo 조립합니다.
견적 요청하기
(Plant & Animal De novo 시퀀싱)
견적 요청하기
(Plant & Animal De novo 시퀀싱)
개요 개요
서비스 특징서비스 특징
적용 분야적용 분야
세부사항세부사항
데이터 분석데이터 분석

De novo 시퀀싱은 참조 유전체에 의존하지 않고 특정 종의 유전체를 시퀀싱하고 조립하여 해당 종의 완전한 유전체 서열 지도를 구축하는 방법입니다. 이 접근법은 포괄적인 유전체 서열 지도를 제공할 뿐만 아니라 해당 종의 진화적 기원과 특정 환경에 대한 적응을 추가로 연구하기 위한 기반을 마련합니다.


Novogene은 실험 수행과 생물정보학 분석에 대한 풍부한 경험을 바탕으로 종의 특성을 정확하고 신속하며 종합적으로 규명하고 신뢰할 수 있는 결과를 제공합니다. 또한 Novogene의 엔드투엔드 서비스는 매우 빠른 처리 시간을 보장합니다.

Novogene 식물 및 동물 De novo 시퀀싱 서비스의 장점

풍부한 경험
풍부한 경험

다양한 식물 및 동물 종에 대해 참조 수준의 유전체를 조립한 입증된 전문성을 보유하고 있습니다.

풍부한 경험
풍부한 경험

다양한 식물 및 동물 종에 대해 참조 수준의 유전체를 조립한 입증된 전문성을 보유하고 있습니다.

고품질 데이터
고품질 데이터

업계 표준 성능과 유전체 조립에 적합한 Contig N50을 갖춘 고품질 시퀀싱 데이터를 제공합니다.

고품질 데이터
고품질 데이터

업계 표준 성능과 유전체 조립에 적합한 Contig N50을 갖춘 고품질 시퀀싱 데이터를 제공합니다.

쇼트 리드 및 롱 리드 통합
쇼트 리드 및 롱 리드 통합

롱 리드와 쇼트 리드 데이터를 결합한 유연한 De novo 시퀀싱 전략으로 포괄적인 유전체 조립을 지원합니다.

쇼트 리드 및 롱 리드 통합
쇼트 리드 및 롱 리드 통합

롱 리드와 쇼트 리드 데이터를 결합한 유연한 De novo 시퀀싱 전략으로 포괄적인 유전체 조립을 지원합니다.

첨단 생물정보학 지원
첨단 생물정보학 지원

롱 리드 데이터 기반의 엔드투엔드 조립 솔루션을 제공하며, T2T 유전체와 Hi-C 통합을 통한 염색체 수준 조립을 지원합니다.


첨단 생물정보학 지원
첨단 생물정보학 지원

롱 리드 데이터 기반의 엔드투엔드 조립 솔루션을 제공하며, T2T 유전체와 Hi-C 통합을 통한 염색체 수준 조립을 지원합니다.


고객 서비스 시스템(CSS)
고객 서비스 시스템(CSS)

프로젝트 추적, 데이터 접근 및 전체 시퀀싱 워크플로에서의 원활한 협업을 지원하는 중앙집중식 플랫폼입니다.

고객 서비스 시스템(CSS)
고객 서비스 시스템(CSS)

프로젝트 추적, 데이터 접근 및 전체 시퀀싱 워크플로에서의 원활한 협업을 지원하는 중앙집중식 플랫폼입니다.

Novogene 식물 및 동물 De novo 시퀀싱 서비스의 장점

풍부한 경험
풍부한 경험

다양한 식물 및 동물 종에 대해 참조 수준의 유전체를 조립한 입증된 전문성을 보유하고 있습니다.

풍부한 경험
풍부한 경험

다양한 식물 및 동물 종에 대해 참조 수준의 유전체를 조립한 입증된 전문성을 보유하고 있습니다.

고품질 데이터
고품질 데이터

업계 표준 성능과 유전체 조립에 적합한 Contig N50을 갖춘 고품질 시퀀싱 데이터를 제공합니다.

고품질 데이터
고품질 데이터

업계 표준 성능과 유전체 조립에 적합한 Contig N50을 갖춘 고품질 시퀀싱 데이터를 제공합니다.

쇼트 리드 및 롱 리드 통합
쇼트 리드 및 롱 리드 통합

롱 리드와 쇼트 리드 데이터를 결합한 유연한 De novo 시퀀싱 전략으로 포괄적인 유전체 조립을 지원합니다.

쇼트 리드 및 롱 리드 통합
쇼트 리드 및 롱 리드 통합

롱 리드와 쇼트 리드 데이터를 결합한 유연한 De novo 시퀀싱 전략으로 포괄적인 유전체 조립을 지원합니다.

첨단 생물정보학 지원
첨단 생물정보학 지원

롱 리드 데이터 기반의 엔드투엔드 조립 솔루션을 제공하며, T2T 유전체와 Hi-C 통합을 통한 염색체 수준 조립을 지원합니다.


첨단 생물정보학 지원
첨단 생물정보학 지원

롱 리드 데이터 기반의 엔드투엔드 조립 솔루션을 제공하며, T2T 유전체와 Hi-C 통합을 통한 염색체 수준 조립을 지원합니다.


고객 서비스 시스템(CSS)
고객 서비스 시스템(CSS)

프로젝트 추적, 데이터 접근 및 전체 시퀀싱 워크플로에서의 원활한 협업을 지원하는 중앙집중식 플랫폼입니다.

고객 서비스 시스템(CSS)
고객 서비스 시스템(CSS)

프로젝트 추적, 데이터 접근 및 전체 시퀀싱 워크플로에서의 원활한 협업을 지원하는 중앙집중식 플랫폼입니다.

식물 및 동물 De novo 시퀀싱의 응용 분야

보전 및 진화 연구(동물)

환경 적응의 유전적 기반을 밝히고 진화 역사를 추적하며 멸종위기종 보호를 위한 중요한 통찰을 제공합니다.

보전 및 진화 연구(동물)

환경 적응의 유전적 기반을 밝히고 진화 역사를 추적하며 멸종위기종 보호를 위한 중요한 통찰을 제공합니다.

농업 및 가축 육종

질병 저항성, 생산성 및 유용 형질과 관련된 유전자를 식별하여 더 건강하고 생산성이 높은 품종 개발을 지원합니다.

농업 및 가축 육종

질병 저항성, 생산성 및 유용 형질과 관련된 유전자를 식별하여 더 건강하고 생산성이 높은 품종 개발을 지원합니다.

생물의학 연구 및 신약 개발

더욱 효과적인 동물 질병 모델(예: 제브라피시) 구축을 지원하고, 암 저항성과 같은 특수 형질을 가진 동물의 고유한 생물학적 경로를 규명하여 신약 개발을 촉진합니다.

생물의학 연구 및 신약 개발

더욱 효과적인 동물 질병 모델(예: 제브라피시) 구축을 지원하고, 암 저항성과 같은 특수 형질을 가진 동물의 고유한 생물학적 경로를 규명하여 신약 개발을 촉진합니다.

작물 개량 및 식량 안보(식물)

완전한 유전적 청사진을 제공하여 수확량이 많고 영양이 풍부하며 스트레스에 강한 작물 품종의 육종을 지원하고 세계 식량 안보에 기여합니다.

작물 개량 및 식량 안보(식물)

완전한 유전적 청사진을 제공하여 수확량이 많고 영양이 풍부하며 스트레스에 강한 작물 품종의 육종을 지원하고 세계 식량 안보에 기여합니다.

진화 및 적응 연구(식물)

진화 역사를 밝히고 환경적 도전에 대한 식물 적응의 유전적 메커니즘을 규명합니다.

진화 및 적응 연구(식물)

진화 역사를 밝히고 환경적 도전에 대한 식물 적응의 유전적 메커니즘을 규명합니다.

유전자원 발굴

가치 있는 화합물과 혁신적인 농업 형질을 결정하는 새로운 유전자를 발굴하여 농업 및 생명공학 분야의 혁신을 촉진합니다.

유전자원 발굴

가치 있는 화합물과 혁신적인 농업 형질을 결정하는 새로운 유전자를 발굴하여 농업 및 생명공학 분야의 혁신을 촉진합니다.

식물 및 동물 De novo 시퀀싱의 응용 분야

보전 및 진화 연구(동물)

환경 적응의 유전적 기반을 밝히고 진화 역사를 추적하며 멸종위기종 보호를 위한 중요한 통찰을 제공합니다.

보전 및 진화 연구(동물)

환경 적응의 유전적 기반을 밝히고 진화 역사를 추적하며 멸종위기종 보호를 위한 중요한 통찰을 제공합니다.

농업 및 가축 육종

질병 저항성, 생산성 및 유용 형질과 관련된 유전자를 식별하여 더 건강하고 생산성이 높은 품종 개발을 지원합니다.

농업 및 가축 육종

질병 저항성, 생산성 및 유용 형질과 관련된 유전자를 식별하여 더 건강하고 생산성이 높은 품종 개발을 지원합니다.

생물의학 연구 및 신약 개발

더욱 효과적인 동물 질병 모델(예: 제브라피시) 구축을 지원하고, 암 저항성과 같은 특수 형질을 가진 동물의 고유한 생물학적 경로를 규명하여 신약 개발을 촉진합니다.

생물의학 연구 및 신약 개발

더욱 효과적인 동물 질병 모델(예: 제브라피시) 구축을 지원하고, 암 저항성과 같은 특수 형질을 가진 동물의 고유한 생물학적 경로를 규명하여 신약 개발을 촉진합니다.

작물 개량 및 식량 안보(식물)

완전한 유전적 청사진을 제공하여 수확량이 많고 영양이 풍부하며 스트레스에 강한 작물 품종의 육종을 지원하고 세계 식량 안보에 기여합니다.

작물 개량 및 식량 안보(식물)

완전한 유전적 청사진을 제공하여 수확량이 많고 영양이 풍부하며 스트레스에 강한 작물 품종의 육종을 지원하고 세계 식량 안보에 기여합니다.

진화 및 적응 연구(식물)

진화 역사를 밝히고 환경적 도전에 대한 식물 적응의 유전적 메커니즘을 규명합니다.

진화 및 적응 연구(식물)

진화 역사를 밝히고 환경적 도전에 대한 식물 적응의 유전적 메커니즘을 규명합니다.

유전자원 발굴

가치 있는 화합물과 혁신적인 농업 형질을 결정하는 새로운 유전자를 발굴하여 농업 및 생명공학 분야의 혁신을 촉진합니다.

유전자원 발굴

가치 있는 화합물과 혁신적인 농업 형질을 결정하는 새로운 유전자를 발굴하여 농업 및 생명공학 분야의 혁신을 촉진합니다.

세부사항

샘플 준비방법

샘플 양은 참고용으로만 제시됩니다. 자세한 내용은 샘플 요구사항을 다운로드하여 확인하십시오. 맞춤형 요청에 대한 자세한 내용은 문의하기를 통해 연락해 주십시오.

Platform TypeSample TypeAmount (Qubit®)Purity
Illumina NovaSeq SystemGenomic DNA≥ 200 ngOD260/280=1.8-2.0;
no degradation,
no contamination
PacBio Revio SystemHMW Genomic DNA≥ 3.5 μgOD260/280=1.75~2.0;
OD260/230=1.5~2.6;
*NC/QC=1.00~2.20;
Fragments should be ≥30K
Nanopore PromethIONHMW Genomic DNA≥ 8.5 μgOD260/280=1.75~2.0;
OD260/230=1.4~2.6;
*NC/QC=0.95~3.00
Fragments should be ≥30K
Nanopore PromethION
(Nanopore Ultra-long DNA Library)
uHMW Genomic DNA≥ 20 μgOD260/280=1.7-2.0;
OD260/230=1.3-2.6;
*NC/QC=0.95-3.00;
Fragments should be ≥ 100k, no fragments below 30k.
*NC/QC = NanoDrop concentration/Qubit concentration

샘플 준비방법

샘플 양은 참고용으로만 제시됩니다. 자세한 내용은 샘플 요구사항을 다운로드하여 확인하십시오. 맞춤형 요청에 대한 자세한 내용은 문의하기를 통해 연락해 주십시오.

Platform TypeSample TypeAmount (Qubit®)Purity
Illumina NovaSeq SystemGenomic DNA≥ 200 ngOD260/280=1.8-2.0;
no degradation,
no contamination
PacBio Revio SystemHMW Genomic DNA≥ 3.5 μgOD260/280=1.75~2.0;
OD260/230=1.5~2.6;
*NC/QC=1.00~2.20;
Fragments should be ≥30K
Nanopore PromethIONHMW Genomic DNA≥ 8.5 μgOD260/280=1.75~2.0;
OD260/230=1.4~2.6;
*NC/QC=0.95~3.00
Fragments should be ≥30K
Nanopore PromethION
(Nanopore Ultra-long DNA Library)
uHMW Genomic DNA≥ 20 μgOD260/280=1.7-2.0;
OD260/230=1.3-2.6;
*NC/QC=0.95-3.00;
Fragments should be ≥ 100k, no fragments below 30k.
*NC/QC = NanoDrop concentration/Qubit concentration

샘플 준비방법

샘플 양은 참고용으로만 제시됩니다. 자세한 내용은 샘플 요구사항을 다운로드하여 확인하십시오. 맞춤형 요청에 대한 자세한 내용은 문의하기를 통해 연락해 주십시오.

Platform TypeSample TypeAmount (Qubit®)Purity
Illumina NovaSeq SystemGenomic DNA≥ 200 ngOD260/280=1.8-2.0;
no degradation,
no contamination
PacBio Revio SystemHMW Genomic DNA≥ 3.5 μgOD260/280=1.75~2.0;
OD260/230=1.5~2.6;
*NC/QC=1.00~2.20;
Fragments should be ≥30K
Nanopore PromethIONHMW Genomic DNA≥ 8.5 μgOD260/280=1.75~2.0;
OD260/230=1.4~2.6;
*NC/QC=0.95~3.00
Fragments should be ≥30K
Nanopore PromethION
(Nanopore Ultra-long DNA Library)
uHMW Genomic DNA≥ 20 μgOD260/280=1.7-2.0;
OD260/230=1.3-2.6;
*NC/QC=0.95-3.00;
Fragments should be ≥ 100k, no fragments below 30k.
*NC/QC = NanoDrop concentration/Qubit concentration

샘플 준비방법

샘플 양은 참고용으로만 제시됩니다. 자세한 내용은 샘플 요구사항을 다운로드하여 확인하십시오. 맞춤형 요청에 대한 자세한 내용은 문의하기를 통해 연락해 주십시오.

Platform TypeSample TypeAmount (Qubit®)Purity
Illumina NovaSeq SystemGenomic DNA≥ 200 ngOD260/280=1.8-2.0;
no degradation,
no contamination
PacBio Revio SystemHMW Genomic DNA≥ 3.5 μgOD260/280=1.75~2.0;
OD260/230=1.5~2.6;
*NC/QC=1.00~2.20;
Fragments should be ≥30K
Nanopore PromethIONHMW Genomic DNA≥ 8.5 μgOD260/280=1.75~2.0;
OD260/230=1.4~2.6;
*NC/QC=0.95~3.00
Fragments should be ≥30K
Nanopore PromethION
(Nanopore Ultra-long DNA Library)
uHMW Genomic DNA≥ 20 μgOD260/280=1.7-2.0;
OD260/230=1.3-2.6;
*NC/QC=0.95-3.00;
Fragments should be ≥ 100k, no fragments below 30k.
*NC/QC = NanoDrop concentration/Qubit concentration

시퀀싱 & 데이터 분석

표시된 권장 데이터 산출량과 분석 내용은 참고용으로만 제공됩니다. 맞춤형 요청에 대한 자세한 내용은 문의하기를 통해 연락해 주십시오.linebreak

Sequencing TypeIllumina NovaSeq SystemPacBio Revio SystemNanopore PromethION System
Read LengthPaired-end 150 bpN50>15 kbAverage > 50 kb
Recommended  Sequencing DepthFor genome survey or assembly polishing: ≥ 50×
RNA requires 4 to 6 different tissue sites.
For genome assembly: ≥ 30×
Standard AnalysisK-mer analysis
GC content analysis
Repeat content rate evaluation
Heterozygous rate evaluation
Genome size evaluation
Long-read assembly
Assembly statistics
Gene completeness evaluation
Genome Annotation-Repeat prediction
Structure prediction
Function prediction
Noncoding RNA prediction

프로젝트 워크플로우

프로젝트 워크플로우

시퀀싱 & 데이터 분석

표시된 권장 데이터 산출량과 분석 내용은 참고용으로만 제공됩니다. 맞춤형 요청에 대한 자세한 내용은 문의하기를 통해 연락해 주십시오.linebreak

Sequencing TypeIllumina NovaSeq SystemPacBio Revio SystemNanopore PromethION System
Read LengthPaired-end 150 bpN50>15 kbAverage > 50 kb
Recommended  Sequencing DepthFor genome survey or assembly polishing: ≥ 50×
RNA requires 4 to 6 different tissue sites.
For genome assembly: ≥ 30×
Standard AnalysisK-mer analysis
GC content analysis
Repeat content rate evaluation
Heterozygous rate evaluation
Genome size evaluation
Long-read assembly
Assembly statistics
Gene completeness evaluation
Genome Annotation-Repeat prediction
Structure prediction
Function prediction
Noncoding RNA prediction

프로젝트 워크플로우

프로젝트 워크플로우

시퀀싱 & 데이터 분석

표시된 권장 데이터 산출량과 분석 내용은 참고용으로만 제공됩니다. 맞춤형 요청에 대한 자세한 내용은 문의하기를 통해 연락해 주십시오.linebreak

Sequencing TypeIllumina NovaSeq SystemPacBio Revio SystemNanopore PromethION System
Read LengthPaired-end 150 bpN50>15 kbAverage > 50 kb
Recommended  Sequencing DepthFor genome survey or assembly polishing: ≥ 50×
RNA requires 4 to 6 different tissue sites.
For genome assembly: ≥ 30×
Standard AnalysisK-mer analysis
GC content analysis
Repeat content rate evaluation
Heterozygous rate evaluation
Genome size evaluation
Long-read assembly
Assembly statistics
Gene completeness evaluation
Genome Annotation-Repeat prediction
Structure prediction
Function prediction
Noncoding RNA prediction

프로젝트 워크플로우

프로젝트 워크플로우

시퀀싱 & 데이터 분석

표시된 권장 데이터 산출량과 분석 내용은 참고용으로만 제공됩니다. 맞춤형 요청에 대한 자세한 내용은 문의하기를 통해 연락해 주십시오.linebreak

Sequencing TypeIllumina NovaSeq SystemPacBio Revio SystemNanopore PromethION System
Read LengthPaired-end 150 bpN50>15 kbAverage > 50 kb
Recommended  Sequencing DepthFor genome survey or assembly polishing: ≥ 50×
RNA requires 4 to 6 different tissue sites.
For genome assembly: ≥ 30×
Standard AnalysisK-mer analysis
GC content analysis
Repeat content rate evaluation
Heterozygous rate evaluation
Genome size evaluation
Long-read assembly
Assembly statistics
Gene completeness evaluation
Genome Annotation-Repeat prediction
Structure prediction
Function prediction
Noncoding RNA prediction

프로젝트 워크플로우

프로젝트 워크플로우

세부사항

샘플 준비방법

샘플 양은 참고용으로만 제시됩니다. 자세한 내용은 샘플 요구사항을 다운로드하여 확인하십시오. 맞춤형 요청에 대한 자세한 내용은 문의하기를 통해 연락해 주십시오.

Platform TypeSample TypeAmount (Qubit®)Purity
Illumina NovaSeq SystemGenomic DNA≥ 200 ngOD260/280=1.8-2.0;
no degradation,
no contamination
PacBio Revio SystemHMW Genomic DNA≥ 3.5 μgOD260/280=1.75~2.0;
OD260/230=1.5~2.6;
*NC/QC=1.00~2.20;
Fragments should be ≥30K
Nanopore PromethIONHMW Genomic DNA≥ 8.5 μgOD260/280=1.75~2.0;
OD260/230=1.4~2.6;
*NC/QC=0.95~3.00
Fragments should be ≥30K
Nanopore PromethION
(Nanopore Ultra-long DNA Library)
uHMW Genomic DNA≥ 20 μgOD260/280=1.7-2.0;
OD260/230=1.3-2.6;
*NC/QC=0.95-3.00;
Fragments should be ≥ 100k, no fragments below 30k.
*NC/QC = NanoDrop concentration/Qubit concentration

샘플 준비방법

샘플 양은 참고용으로만 제시됩니다. 자세한 내용은 샘플 요구사항을 다운로드하여 확인하십시오. 맞춤형 요청에 대한 자세한 내용은 문의하기를 통해 연락해 주십시오.

Platform TypeSample TypeAmount (Qubit®)Purity
Illumina NovaSeq SystemGenomic DNA≥ 200 ngOD260/280=1.8-2.0;
no degradation,
no contamination
PacBio Revio SystemHMW Genomic DNA≥ 3.5 μgOD260/280=1.75~2.0;
OD260/230=1.5~2.6;
*NC/QC=1.00~2.20;
Fragments should be ≥30K
Nanopore PromethIONHMW Genomic DNA≥ 8.5 μgOD260/280=1.75~2.0;
OD260/230=1.4~2.6;
*NC/QC=0.95~3.00
Fragments should be ≥30K
Nanopore PromethION
(Nanopore Ultra-long DNA Library)
uHMW Genomic DNA≥ 20 μgOD260/280=1.7-2.0;
OD260/230=1.3-2.6;
*NC/QC=0.95-3.00;
Fragments should be ≥ 100k, no fragments below 30k.
*NC/QC = NanoDrop concentration/Qubit concentration

샘플 준비방법

샘플 양은 참고용으로만 제시됩니다. 자세한 내용은 샘플 요구사항을 다운로드하여 확인하십시오. 맞춤형 요청에 대한 자세한 내용은 문의하기를 통해 연락해 주십시오.

Platform TypeSample TypeAmount (Qubit®)Purity
Illumina NovaSeq SystemGenomic DNA≥ 200 ngOD260/280=1.8-2.0;
no degradation,
no contamination
PacBio Revio SystemHMW Genomic DNA≥ 3.5 μgOD260/280=1.75~2.0;
OD260/230=1.5~2.6;
*NC/QC=1.00~2.20;
Fragments should be ≥30K
Nanopore PromethIONHMW Genomic DNA≥ 8.5 μgOD260/280=1.75~2.0;
OD260/230=1.4~2.6;
*NC/QC=0.95~3.00
Fragments should be ≥30K
Nanopore PromethION
(Nanopore Ultra-long DNA Library)
uHMW Genomic DNA≥ 20 μgOD260/280=1.7-2.0;
OD260/230=1.3-2.6;
*NC/QC=0.95-3.00;
Fragments should be ≥ 100k, no fragments below 30k.
*NC/QC = NanoDrop concentration/Qubit concentration

샘플 준비방법

샘플 양은 참고용으로만 제시됩니다. 자세한 내용은 샘플 요구사항을 다운로드하여 확인하십시오. 맞춤형 요청에 대한 자세한 내용은 문의하기를 통해 연락해 주십시오.

Platform TypeSample TypeAmount (Qubit®)Purity
Illumina NovaSeq SystemGenomic DNA≥ 200 ngOD260/280=1.8-2.0;
no degradation,
no contamination
PacBio Revio SystemHMW Genomic DNA≥ 3.5 μgOD260/280=1.75~2.0;
OD260/230=1.5~2.6;
*NC/QC=1.00~2.20;
Fragments should be ≥30K
Nanopore PromethIONHMW Genomic DNA≥ 8.5 μgOD260/280=1.75~2.0;
OD260/230=1.4~2.6;
*NC/QC=0.95~3.00
Fragments should be ≥30K
Nanopore PromethION
(Nanopore Ultra-long DNA Library)
uHMW Genomic DNA≥ 20 μgOD260/280=1.7-2.0;
OD260/230=1.3-2.6;
*NC/QC=0.95-3.00;
Fragments should be ≥ 100k, no fragments below 30k.
*NC/QC = NanoDrop concentration/Qubit concentration

시퀀싱 & 데이터 분석

표시된 권장 데이터 산출량과 분석 내용은 참고용으로만 제공됩니다. 맞춤형 요청에 대한 자세한 내용은 문의하기를 통해 연락해 주십시오.linebreak

Sequencing TypeIllumina NovaSeq SystemPacBio Revio SystemNanopore PromethION System
Read LengthPaired-end 150 bpN50>15 kbAverage > 50 kb
Recommended  Sequencing DepthFor genome survey or assembly polishing: ≥ 50×
RNA requires 4 to 6 different tissue sites.
For genome assembly: ≥ 30×
Standard AnalysisK-mer analysis
GC content analysis
Repeat content rate evaluation
Heterozygous rate evaluation
Genome size evaluation
Long-read assembly
Assembly statistics
Gene completeness evaluation
Genome Annotation-Repeat prediction
Structure prediction
Function prediction
Noncoding RNA prediction

프로젝트 워크플로우

프로젝트 워크플로우

시퀀싱 & 데이터 분석

표시된 권장 데이터 산출량과 분석 내용은 참고용으로만 제공됩니다. 맞춤형 요청에 대한 자세한 내용은 문의하기를 통해 연락해 주십시오.linebreak

Sequencing TypeIllumina NovaSeq SystemPacBio Revio SystemNanopore PromethION System
Read LengthPaired-end 150 bpN50>15 kbAverage > 50 kb
Recommended  Sequencing DepthFor genome survey or assembly polishing: ≥ 50×
RNA requires 4 to 6 different tissue sites.
For genome assembly: ≥ 30×
Standard AnalysisK-mer analysis
GC content analysis
Repeat content rate evaluation
Heterozygous rate evaluation
Genome size evaluation
Long-read assembly
Assembly statistics
Gene completeness evaluation
Genome Annotation-Repeat prediction
Structure prediction
Function prediction
Noncoding RNA prediction

프로젝트 워크플로우

프로젝트 워크플로우

시퀀싱 & 데이터 분석

표시된 권장 데이터 산출량과 분석 내용은 참고용으로만 제공됩니다. 맞춤형 요청에 대한 자세한 내용은 문의하기를 통해 연락해 주십시오.linebreak

Sequencing TypeIllumina NovaSeq SystemPacBio Revio SystemNanopore PromethION System
Read LengthPaired-end 150 bpN50>15 kbAverage > 50 kb
Recommended  Sequencing DepthFor genome survey or assembly polishing: ≥ 50×
RNA requires 4 to 6 different tissue sites.
For genome assembly: ≥ 30×
Standard AnalysisK-mer analysis
GC content analysis
Repeat content rate evaluation
Heterozygous rate evaluation
Genome size evaluation
Long-read assembly
Assembly statistics
Gene completeness evaluation
Genome Annotation-Repeat prediction
Structure prediction
Function prediction
Noncoding RNA prediction

프로젝트 워크플로우

프로젝트 워크플로우

시퀀싱 & 데이터 분석

표시된 권장 데이터 산출량과 분석 내용은 참고용으로만 제공됩니다. 맞춤형 요청에 대한 자세한 내용은 문의하기를 통해 연락해 주십시오.linebreak

Sequencing TypeIllumina NovaSeq SystemPacBio Revio SystemNanopore PromethION System
Read LengthPaired-end 150 bpN50>15 kbAverage > 50 kb
Recommended  Sequencing DepthFor genome survey or assembly polishing: ≥ 50×
RNA requires 4 to 6 different tissue sites.
For genome assembly: ≥ 30×
Standard AnalysisK-mer analysis
GC content analysis
Repeat content rate evaluation
Heterozygous rate evaluation
Genome size evaluation
Long-read assembly
Assembly statistics
Gene completeness evaluation
Genome Annotation-Repeat prediction
Structure prediction
Function prediction
Noncoding RNA prediction

프로젝트 워크플로우

프로젝트 워크플로우

데이터 분석 예시

Image
Image
1/1
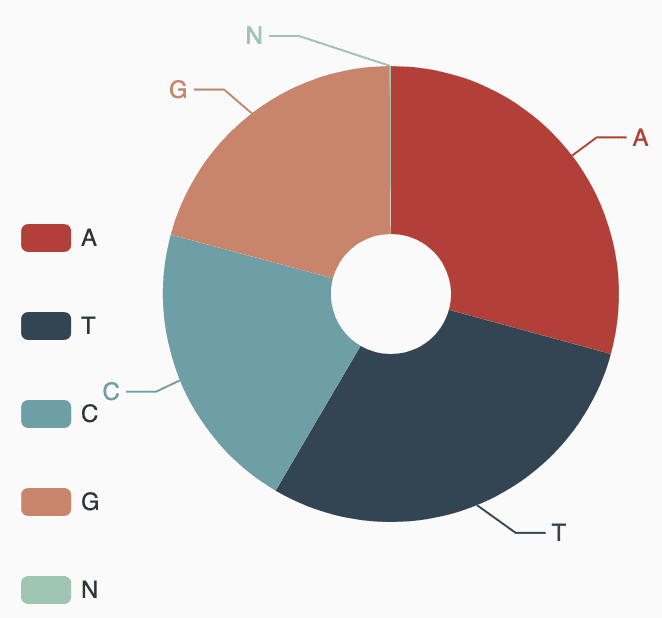
조립 통계

곡물진딧물 유전체의 A/T/G/C 함량 통계

Image
Image
1/1
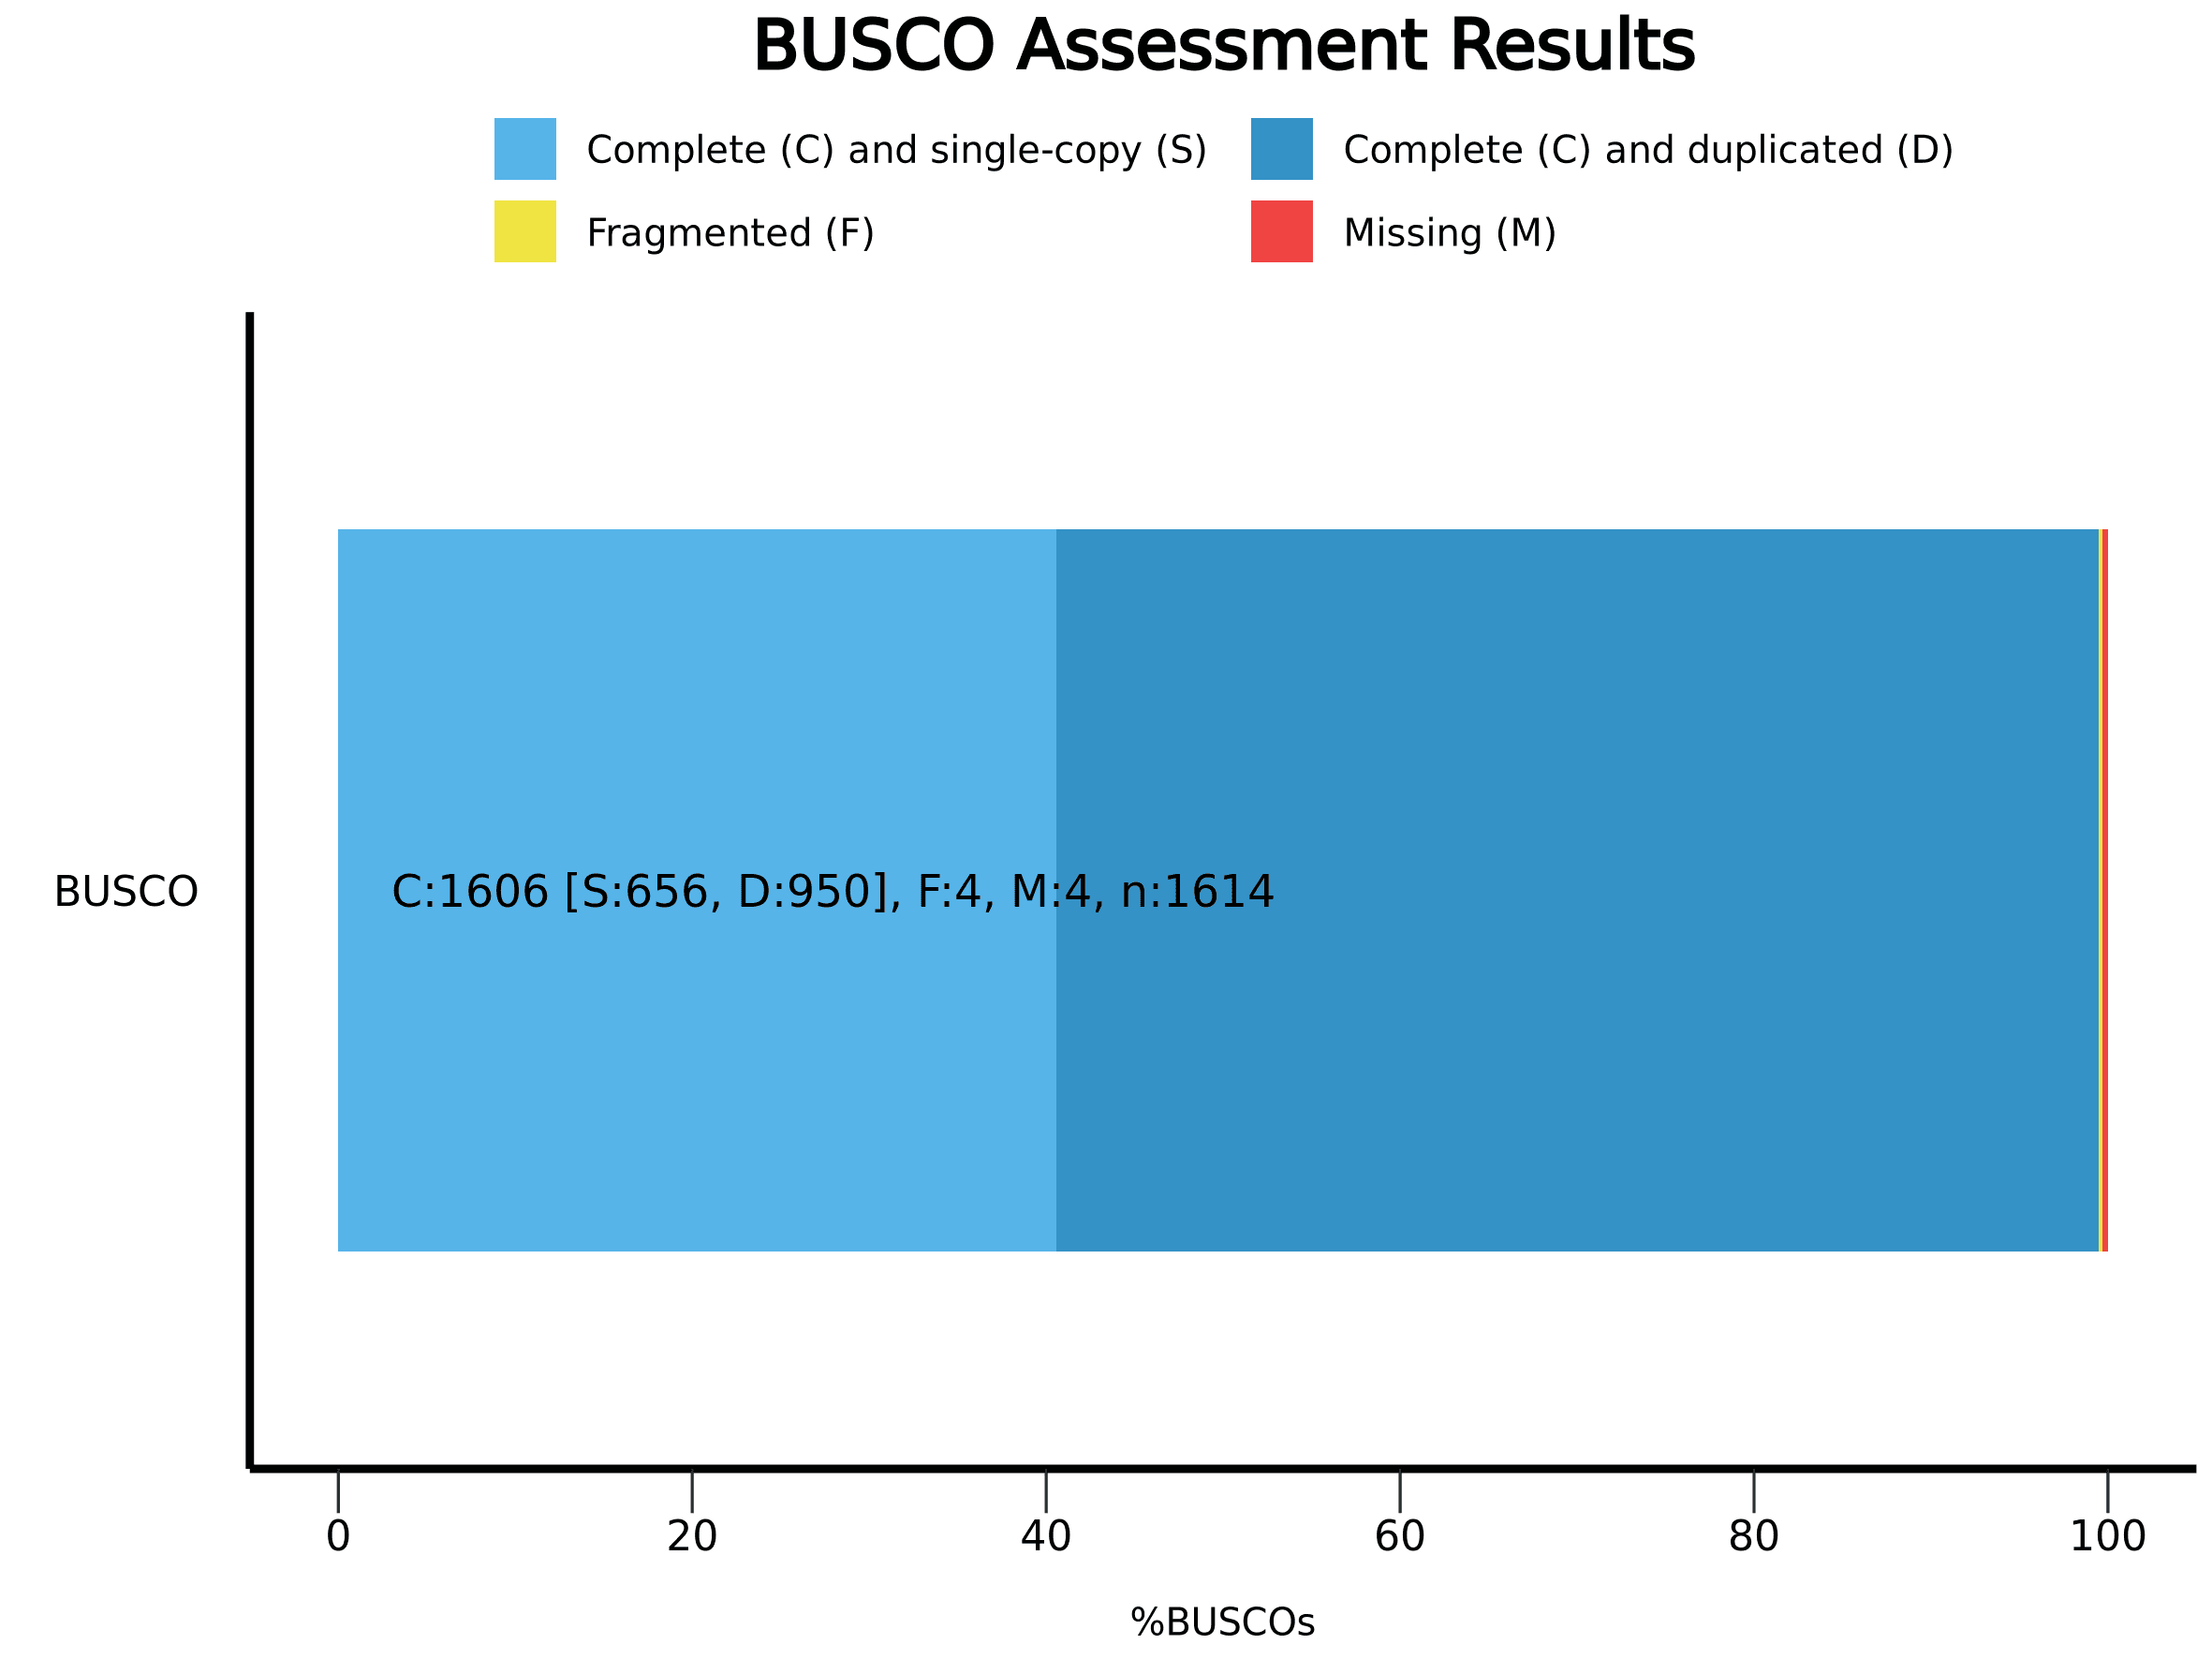
조립 평가 - BUSCO 평가

BUSCO 평가 결과

참고: C: 완전한 BUSCO; S: 완전한 단일 사본 BUSCO; D: 완전한 중복 BUSCO; F: 단편화된 BUSCO; M: 누락된 BUSCO; n: 검색된 전체 BUSCO 그룹 수

Image
Image
1/1
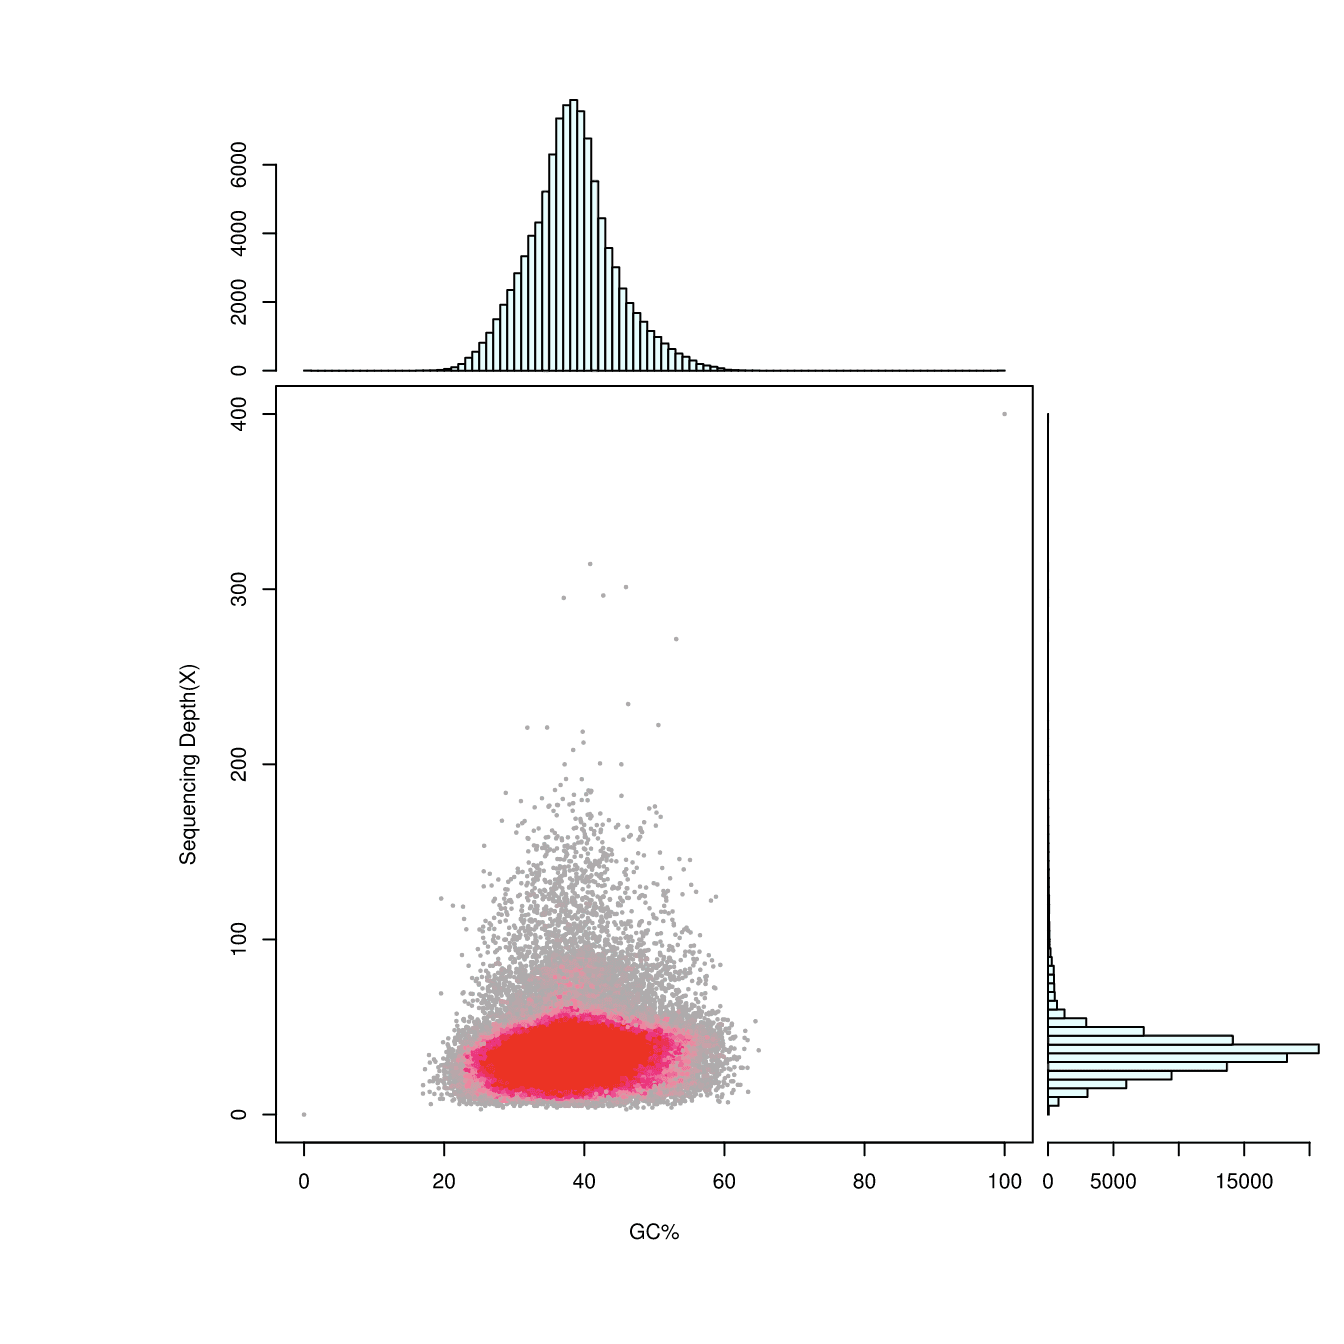
GC 함량 및 깊이 분포

x축: GC 함량; y축: 시퀀싱 깊이.

상단: GC 함량 분포.

오른쪽 하단: 시퀀싱 깊이 분포.

Image
Image
1/1
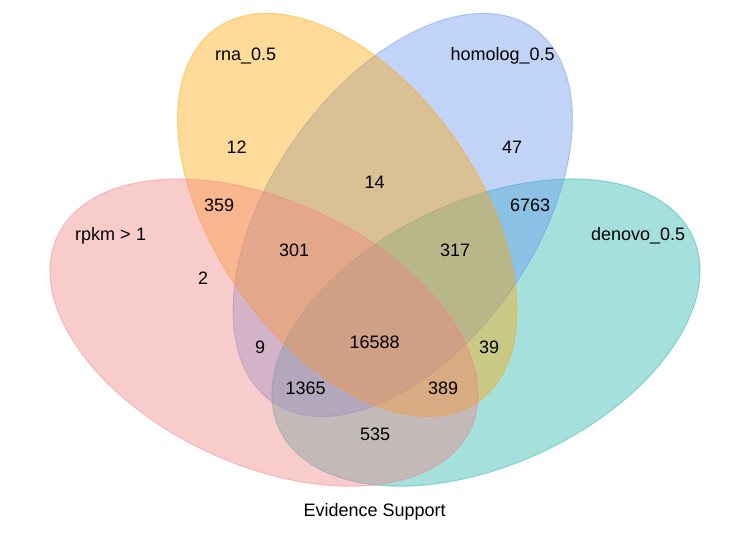
근거 지원

유전자 세트 근거 지원의 벤 다이어그램입니다. Augustus, GlimmerHMM, SNAP, Geneid 및 Genscan은 De novo 유전자 구조 예측에 사용됩니다.

Image
Image
1/1
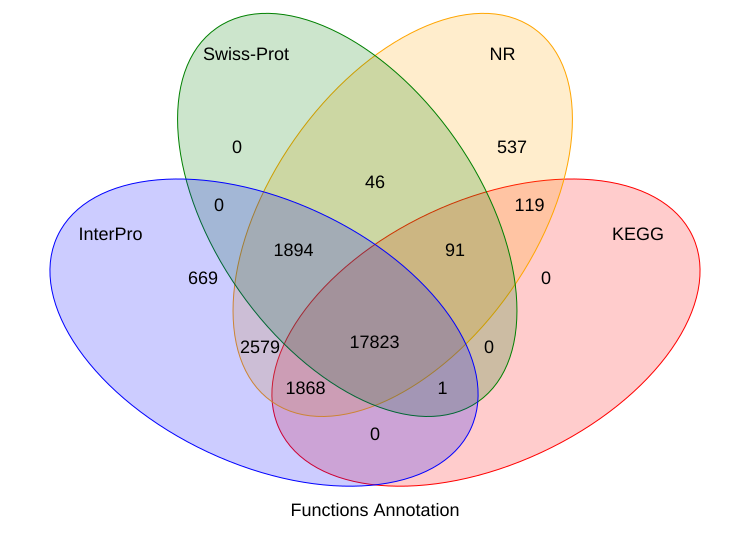
기능 예측

유전자 기능 주석의 벤 다이어그램입니다. 유전자 구조를 통해 예측된 단백질 서열을 알려진 단백질 데이터베이스와 정렬합니다. 결과에 따르면 유전자의 95.8%에 대한 기능을 예측할 수 있었습니다.

Image
Image
1/1
조립 통계

곡물진딧물 유전체의 A/T/G/C 함량 통계

Image
Image
1/1
조립 평가 - BUSCO 평가

BUSCO 평가 결과

참고: C: 완전한 BUSCO; S: 완전한 단일 사본 BUSCO; D: 완전한 중복 BUSCO; F: 단편화된 BUSCO; M: 누락된 BUSCO; n: 검색된 전체 BUSCO 그룹 수

Image
Image
1/1
GC 함량 및 깊이 분포

x축: GC 함량; y축: 시퀀싱 깊이.

상단: GC 함량 분포.

오른쪽 하단: 시퀀싱 깊이 분포.

Image
Image
1/1
근거 지원

유전자 세트 근거 지원의 벤 다이어그램입니다. Augustus, GlimmerHMM, SNAP, Geneid 및 Genscan은 De novo 유전자 구조 예측에 사용됩니다.

Image
Image
1/1
기능 예측

유전자 기능 주석의 벤 다이어그램입니다. 유전자 구조를 통해 예측된 단백질 서열을 알려진 단백질 데이터베이스와 정렬합니다. 결과에 따르면 유전자의 95.8%에 대한 기능을 예측할 수 있었습니다.

데이터 분석 예시

Image
Image
1/1
조립 통계

곡물진딧물 유전체의 A/T/G/C 함량 통계

Image
Image
1/1
조립 평가 - BUSCO 평가

BUSCO 평가 결과

참고: C: 완전한 BUSCO; S: 완전한 단일 사본 BUSCO; D: 완전한 중복 BUSCO; F: 단편화된 BUSCO; M: 누락된 BUSCO; n: 검색된 전체 BUSCO 그룹 수

Image
Image
1/1
GC 함량 및 깊이 분포

x축: GC 함량; y축: 시퀀싱 깊이.

상단: GC 함량 분포.

오른쪽 하단: 시퀀싱 깊이 분포.

Image
Image
1/1
근거 지원

유전자 세트 근거 지원의 벤 다이어그램입니다. Augustus, GlimmerHMM, SNAP, Geneid 및 Genscan은 De novo 유전자 구조 예측에 사용됩니다.

Image
Image
1/1
기능 예측

유전자 기능 주석의 벤 다이어그램입니다. 유전자 구조를 통해 예측된 단백질 서열을 알려진 단백질 데이터베이스와 정렬합니다. 결과에 따르면 유전자의 95.8%에 대한 기능을 예측할 수 있었습니다.

Image
Image
1/1
조립 통계

곡물진딧물 유전체의 A/T/G/C 함량 통계

Image
Image
1/1
조립 평가 - BUSCO 평가

BUSCO 평가 결과

참고: C: 완전한 BUSCO; S: 완전한 단일 사본 BUSCO; D: 완전한 중복 BUSCO; F: 단편화된 BUSCO; M: 누락된 BUSCO; n: 검색된 전체 BUSCO 그룹 수

Image
Image
1/1
GC 함량 및 깊이 분포

x축: GC 함량; y축: 시퀀싱 깊이.

상단: GC 함량 분포.

오른쪽 하단: 시퀀싱 깊이 분포.

Image
Image
1/1
근거 지원

유전자 세트 근거 지원의 벤 다이어그램입니다. Augustus, GlimmerHMM, SNAP, Geneid 및 Genscan은 De novo 유전자 구조 예측에 사용됩니다.

Image
Image
1/1
기능 예측

유전자 기능 주석의 벤 다이어그램입니다. 유전자 구조를 통해 예측된 단백질 서열을 알려진 단백질 데이터베이스와 정렬합니다. 결과에 따르면 유전자의 95.8%에 대한 기능을 예측할 수 있었습니다.

K-mer 분석

Kmer=17 분석 및 유전체 크기 평가

SampleKmerDepthn_kmerGenome_size(M)Genome_size(M)Genome_size(M)Repeat_rate(%)
plant173624,079,467,724668.87668.87668.8773
(1) K-mer: Selected K-mer length.
(2) Depth:The expected value of K-mer depth.
(3) n_K-mer:The total number of K-mer from SOAPdenovo.
(4) Genome size(M):The genome size in Mb estimated by formula: Genome Size=K-mer_num/Peak_depth.
(5) Revise Genome size(M):Revised genome size after error correction from wrong K-mer.
(6) Heteozygous ratio:The percent of heteozygous positions.
(7) Repeat:Calculated by the percentage of K-mer numbers after 1.8-fold of the main peak of total K-mer numbers.
Note: The repeat here is a mathematically repeated sequence but not a repeat element with certain biological functions.
SampleKmerDepthn_kmerGenome_size(M)Genome_size(M)Genome_size(M)Repeat_rate(%)
plant173624,079,467,724668.87668.87668.8773
(1) K-mer: Selected K-mer length.
(2) Depth:The expected value of K-mer depth.
(3) n_K-mer:The total number of K-mer from SOAPdenovo.
(4) Genome size(M):The genome size in Mb estimated by formula: Genome Size=K-mer_num/Peak_depth.
(5) Revise Genome size(M):Revised genome size after error correction from wrong K-mer.
(6) Heteozygous ratio:The percent of heteozygous positions.
(7) Repeat:Calculated by the percentage of K-mer numbers after 1.8-fold of the main peak of total K-mer numbers.
Note: The repeat here is a mathematically repeated sequence but not a repeat element with certain biological functions.
SampleKmerDepthn_kmerGenome_size(M)Genome_size(M)Genome_size(M)Repeat_rate(%)
plant173624,079,467,724668.87668.87668.8773
(1) K-mer: Selected K-mer length.
(2) Depth:The expected value of K-mer depth.
(3) n_K-mer:The total number of K-mer from SOAPdenovo.
(4) Genome size(M):The genome size in Mb estimated by formula: Genome Size=K-mer_num/Peak_depth.
(5) Revise Genome size(M):Revised genome size after error correction from wrong K-mer.
(6) Heteozygous ratio:The percent of heteozygous positions.
(7) Repeat:Calculated by the percentage of K-mer numbers after 1.8-fold of the main peak of total K-mer numbers.
Note: The repeat here is a mathematically repeated sequence but not a repeat element with certain biological functions.
SampleKmerDepthn_kmerGenome_size(M)Genome_size(M)Genome_size(M)Repeat_rate(%)
plant173624,079,467,724668.87668.87668.8773
(1) K-mer: Selected K-mer length.
(2) Depth:The expected value of K-mer depth.
(3) n_K-mer:The total number of K-mer from SOAPdenovo.
(4) Genome size(M):The genome size in Mb estimated by formula: Genome Size=K-mer_num/Peak_depth.
(5) Revise Genome size(M):Revised genome size after error correction from wrong K-mer.
(6) Heteozygous ratio:The percent of heteozygous positions.
(7) Repeat:Calculated by the percentage of K-mer numbers after 1.8-fold of the main peak of total K-mer numbers.
Note: The repeat here is a mathematically repeated sequence but not a repeat element with certain biological functions.

K-mer 분석

Kmer=17 분석 및 유전체 크기 평가

SampleKmerDepthn_kmerGenome_size(M)Genome_size(M)Genome_size(M)Repeat_rate(%)
plant173624,079,467,724668.87668.87668.8773
(1) K-mer: Selected K-mer length.
(2) Depth:The expected value of K-mer depth.
(3) n_K-mer:The total number of K-mer from SOAPdenovo.
(4) Genome size(M):The genome size in Mb estimated by formula: Genome Size=K-mer_num/Peak_depth.
(5) Revise Genome size(M):Revised genome size after error correction from wrong K-mer.
(6) Heteozygous ratio:The percent of heteozygous positions.
(7) Repeat:Calculated by the percentage of K-mer numbers after 1.8-fold of the main peak of total K-mer numbers.
Note: The repeat here is a mathematically repeated sequence but not a repeat element with certain biological functions.
SampleKmerDepthn_kmerGenome_size(M)Genome_size(M)Genome_size(M)Repeat_rate(%)
plant173624,079,467,724668.87668.87668.8773
(1) K-mer: Selected K-mer length.
(2) Depth:The expected value of K-mer depth.
(3) n_K-mer:The total number of K-mer from SOAPdenovo.
(4) Genome size(M):The genome size in Mb estimated by formula: Genome Size=K-mer_num/Peak_depth.
(5) Revise Genome size(M):Revised genome size after error correction from wrong K-mer.
(6) Heteozygous ratio:The percent of heteozygous positions.
(7) Repeat:Calculated by the percentage of K-mer numbers after 1.8-fold of the main peak of total K-mer numbers.
Note: The repeat here is a mathematically repeated sequence but not a repeat element with certain biological functions.
SampleKmerDepthn_kmerGenome_size(M)Genome_size(M)Genome_size(M)Repeat_rate(%)
plant173624,079,467,724668.87668.87668.8773
(1) K-mer: Selected K-mer length.
(2) Depth:The expected value of K-mer depth.
(3) n_K-mer:The total number of K-mer from SOAPdenovo.
(4) Genome size(M):The genome size in Mb estimated by formula: Genome Size=K-mer_num/Peak_depth.
(5) Revise Genome size(M):Revised genome size after error correction from wrong K-mer.
(6) Heteozygous ratio:The percent of heteozygous positions.
(7) Repeat:Calculated by the percentage of K-mer numbers after 1.8-fold of the main peak of total K-mer numbers.
Note: The repeat here is a mathematically repeated sequence but not a repeat element with certain biological functions.
SampleKmerDepthn_kmerGenome_size(M)Genome_size(M)Genome_size(M)Repeat_rate(%)
plant173624,079,467,724668.87668.87668.8773
(1) K-mer: Selected K-mer length.
(2) Depth:The expected value of K-mer depth.
(3) n_K-mer:The total number of K-mer from SOAPdenovo.
(4) Genome size(M):The genome size in Mb estimated by formula: Genome Size=K-mer_num/Peak_depth.
(5) Revise Genome size(M):Revised genome size after error correction from wrong K-mer.
(6) Heteozygous ratio:The percent of heteozygous positions.
(7) Repeat:Calculated by the percentage of K-mer numbers after 1.8-fold of the main peak of total K-mer numbers.
Note: The repeat here is a mathematically repeated sequence but not a repeat element with certain biological functions.

자주 묻는 질문

조립 결과의 신뢰성을 어떻게 보장할 수 있나요? 조립의 완전성과 정확성을 평가하는 주요 방법은 무엇인가요?

Contig N50 및 Scaffold N50 지표를 확보하는 것 외에도 조립 품질을 평가하는 것이 중요합니다. 일반적인 평가 방법으로는 BUSCO, LAI, Merqury, CEGMA, EST 서열 평가, RNA 서열 평가 및 컨센서스 평가가 있습니다. 이 중 BUSCO는 단일 사본 상동 유전자 라이브러리를 사용하여 유전체를 평가하고, LAI는 긴 말단 반복 역전이인자를 기반으로 유전체 완전성을 평가하며, Merqury는 유전체의 QV(Quality Value)를 평가합니다. 현재 이 세 가지 평가 방법이 가장 널리 사용되고 있습니다.

De novo 조립에 권장되는 전략은 무엇인가요?

Survey와 Genome De Novo에 동일한 DNA가 필요한가요?

다른 서비스 탐색

Total RNA seq
(Total RNA seq)
Total RNA seq
(Total RNA seq)
Full-length 전사체 시퀀싱
(Full-length 전사체 시퀀싱)
Full-length 전사체 시퀀싱
(Full-length 전사체 시퀀싱)
PAWGS
(PAWGS)
PAWGS
(PAWGS)

다른 서비스 탐색

Total RNA seq
(Total RNA seq)
Total RNA seq
(Total RNA seq)
Full-length 전사체 시퀀싱
(Full-length 전사체 시퀀싱)
Full-length 전사체 시퀀싱
(Full-length 전사체 시퀀싱)
PAWGS
(PAWGS)
PAWGS
(PAWGS)
Background
Background

프로젝트를 시작할 준비가 되셨나요?

문의 내용을 보내주시면 Novogene 전문가가 연락드리겠습니다.


Privacy PolicyCookie Policy
banner laptop bg
banner mobile bg

Plant & Animal De novo 시퀀싱

복잡한 유전체와 종 특이적 유전체 특성을 정확하게 규명할 수 있도록 식물 및 동물 유전체를 De novo 조립합니다.
견적 요청하기
(Plant & Animal De novo 시퀀싱)
견적 요청하기
(Plant & Animal De novo 시퀀싱)
개요 개요
서비스 특징서비스 특징
적용 분야적용 분야
세부사항세부사항
데이터 분석데이터 분석

De novo 시퀀싱은 참조 유전체에 의존하지 않고 특정 종의 유전체를 시퀀싱하고 조립하여 해당 종의 완전한 유전체 서열 지도를 구축하는 방법입니다. 이 접근법은 포괄적인 유전체 서열 지도를 제공할 뿐만 아니라 해당 종의 진화적 기원과 특정 환경에 대한 적응을 추가로 연구하기 위한 기반을 마련합니다.


Novogene은 실험 수행과 생물정보학 분석에 대한 풍부한 경험을 바탕으로 종의 특성을 정확하고 신속하며 종합적으로 규명하고 신뢰할 수 있는 결과를 제공합니다. 또한 Novogene의 엔드투엔드 서비스는 매우 빠른 처리 시간을 보장합니다.

Novogene 식물 및 동물 De novo 시퀀싱 서비스의 장점

풍부한 경험
풍부한 경험

다양한 식물 및 동물 종에 대해 참조 수준의 유전체를 조립한 입증된 전문성을 보유하고 있습니다.

풍부한 경험
풍부한 경험

다양한 식물 및 동물 종에 대해 참조 수준의 유전체를 조립한 입증된 전문성을 보유하고 있습니다.

고품질 데이터
고품질 데이터

업계 표준 성능과 유전체 조립에 적합한 Contig N50을 갖춘 고품질 시퀀싱 데이터를 제공합니다.

고품질 데이터
고품질 데이터

업계 표준 성능과 유전체 조립에 적합한 Contig N50을 갖춘 고품질 시퀀싱 데이터를 제공합니다.

쇼트 리드 및 롱 리드 통합
쇼트 리드 및 롱 리드 통합

롱 리드와 쇼트 리드 데이터를 결합한 유연한 De novo 시퀀싱 전략으로 포괄적인 유전체 조립을 지원합니다.

쇼트 리드 및 롱 리드 통합
쇼트 리드 및 롱 리드 통합

롱 리드와 쇼트 리드 데이터를 결합한 유연한 De novo 시퀀싱 전략으로 포괄적인 유전체 조립을 지원합니다.

첨단 생물정보학 지원
첨단 생물정보학 지원

롱 리드 데이터 기반의 엔드투엔드 조립 솔루션을 제공하며, T2T 유전체와 Hi-C 통합을 통한 염색체 수준 조립을 지원합니다.


첨단 생물정보학 지원
첨단 생물정보학 지원

롱 리드 데이터 기반의 엔드투엔드 조립 솔루션을 제공하며, T2T 유전체와 Hi-C 통합을 통한 염색체 수준 조립을 지원합니다.


고객 서비스 시스템(CSS)
고객 서비스 시스템(CSS)

프로젝트 추적, 데이터 접근 및 전체 시퀀싱 워크플로에서의 원활한 협업을 지원하는 중앙집중식 플랫폼입니다.

고객 서비스 시스템(CSS)
고객 서비스 시스템(CSS)

프로젝트 추적, 데이터 접근 및 전체 시퀀싱 워크플로에서의 원활한 협업을 지원하는 중앙집중식 플랫폼입니다.

Novogene 식물 및 동물 De novo 시퀀싱 서비스의 장점

풍부한 경험
풍부한 경험

다양한 식물 및 동물 종에 대해 참조 수준의 유전체를 조립한 입증된 전문성을 보유하고 있습니다.

풍부한 경험
풍부한 경험

다양한 식물 및 동물 종에 대해 참조 수준의 유전체를 조립한 입증된 전문성을 보유하고 있습니다.

고품질 데이터
고품질 데이터

업계 표준 성능과 유전체 조립에 적합한 Contig N50을 갖춘 고품질 시퀀싱 데이터를 제공합니다.

고품질 데이터
고품질 데이터

업계 표준 성능과 유전체 조립에 적합한 Contig N50을 갖춘 고품질 시퀀싱 데이터를 제공합니다.

쇼트 리드 및 롱 리드 통합
쇼트 리드 및 롱 리드 통합

롱 리드와 쇼트 리드 데이터를 결합한 유연한 De novo 시퀀싱 전략으로 포괄적인 유전체 조립을 지원합니다.

쇼트 리드 및 롱 리드 통합
쇼트 리드 및 롱 리드 통합

롱 리드와 쇼트 리드 데이터를 결합한 유연한 De novo 시퀀싱 전략으로 포괄적인 유전체 조립을 지원합니다.

첨단 생물정보학 지원
첨단 생물정보학 지원

롱 리드 데이터 기반의 엔드투엔드 조립 솔루션을 제공하며, T2T 유전체와 Hi-C 통합을 통한 염색체 수준 조립을 지원합니다.


첨단 생물정보학 지원
첨단 생물정보학 지원

롱 리드 데이터 기반의 엔드투엔드 조립 솔루션을 제공하며, T2T 유전체와 Hi-C 통합을 통한 염색체 수준 조립을 지원합니다.


고객 서비스 시스템(CSS)
고객 서비스 시스템(CSS)

프로젝트 추적, 데이터 접근 및 전체 시퀀싱 워크플로에서의 원활한 협업을 지원하는 중앙집중식 플랫폼입니다.

고객 서비스 시스템(CSS)
고객 서비스 시스템(CSS)

프로젝트 추적, 데이터 접근 및 전체 시퀀싱 워크플로에서의 원활한 협업을 지원하는 중앙집중식 플랫폼입니다.

식물 및 동물 De novo 시퀀싱의 응용 분야

보전 및 진화 연구(동물)

환경 적응의 유전적 기반을 밝히고 진화 역사를 추적하며 멸종위기종 보호를 위한 중요한 통찰을 제공합니다.

보전 및 진화 연구(동물)

환경 적응의 유전적 기반을 밝히고 진화 역사를 추적하며 멸종위기종 보호를 위한 중요한 통찰을 제공합니다.

농업 및 가축 육종

질병 저항성, 생산성 및 유용 형질과 관련된 유전자를 식별하여 더 건강하고 생산성이 높은 품종 개발을 지원합니다.

농업 및 가축 육종

질병 저항성, 생산성 및 유용 형질과 관련된 유전자를 식별하여 더 건강하고 생산성이 높은 품종 개발을 지원합니다.

생물의학 연구 및 신약 개발

더욱 효과적인 동물 질병 모델(예: 제브라피시) 구축을 지원하고, 암 저항성과 같은 특수 형질을 가진 동물의 고유한 생물학적 경로를 규명하여 신약 개발을 촉진합니다.

생물의학 연구 및 신약 개발

더욱 효과적인 동물 질병 모델(예: 제브라피시) 구축을 지원하고, 암 저항성과 같은 특수 형질을 가진 동물의 고유한 생물학적 경로를 규명하여 신약 개발을 촉진합니다.

작물 개량 및 식량 안보(식물)

완전한 유전적 청사진을 제공하여 수확량이 많고 영양이 풍부하며 스트레스에 강한 작물 품종의 육종을 지원하고 세계 식량 안보에 기여합니다.

작물 개량 및 식량 안보(식물)

완전한 유전적 청사진을 제공하여 수확량이 많고 영양이 풍부하며 스트레스에 강한 작물 품종의 육종을 지원하고 세계 식량 안보에 기여합니다.

진화 및 적응 연구(식물)

진화 역사를 밝히고 환경적 도전에 대한 식물 적응의 유전적 메커니즘을 규명합니다.

진화 및 적응 연구(식물)

진화 역사를 밝히고 환경적 도전에 대한 식물 적응의 유전적 메커니즘을 규명합니다.

유전자원 발굴

가치 있는 화합물과 혁신적인 농업 형질을 결정하는 새로운 유전자를 발굴하여 농업 및 생명공학 분야의 혁신을 촉진합니다.

유전자원 발굴

가치 있는 화합물과 혁신적인 농업 형질을 결정하는 새로운 유전자를 발굴하여 농업 및 생명공학 분야의 혁신을 촉진합니다.

식물 및 동물 De novo 시퀀싱의 응용 분야

보전 및 진화 연구(동물)

환경 적응의 유전적 기반을 밝히고 진화 역사를 추적하며 멸종위기종 보호를 위한 중요한 통찰을 제공합니다.

보전 및 진화 연구(동물)

환경 적응의 유전적 기반을 밝히고 진화 역사를 추적하며 멸종위기종 보호를 위한 중요한 통찰을 제공합니다.

농업 및 가축 육종

질병 저항성, 생산성 및 유용 형질과 관련된 유전자를 식별하여 더 건강하고 생산성이 높은 품종 개발을 지원합니다.

농업 및 가축 육종

질병 저항성, 생산성 및 유용 형질과 관련된 유전자를 식별하여 더 건강하고 생산성이 높은 품종 개발을 지원합니다.

생물의학 연구 및 신약 개발

더욱 효과적인 동물 질병 모델(예: 제브라피시) 구축을 지원하고, 암 저항성과 같은 특수 형질을 가진 동물의 고유한 생물학적 경로를 규명하여 신약 개발을 촉진합니다.

생물의학 연구 및 신약 개발

더욱 효과적인 동물 질병 모델(예: 제브라피시) 구축을 지원하고, 암 저항성과 같은 특수 형질을 가진 동물의 고유한 생물학적 경로를 규명하여 신약 개발을 촉진합니다.

작물 개량 및 식량 안보(식물)

완전한 유전적 청사진을 제공하여 수확량이 많고 영양이 풍부하며 스트레스에 강한 작물 품종의 육종을 지원하고 세계 식량 안보에 기여합니다.

작물 개량 및 식량 안보(식물)

완전한 유전적 청사진을 제공하여 수확량이 많고 영양이 풍부하며 스트레스에 강한 작물 품종의 육종을 지원하고 세계 식량 안보에 기여합니다.

진화 및 적응 연구(식물)

진화 역사를 밝히고 환경적 도전에 대한 식물 적응의 유전적 메커니즘을 규명합니다.

진화 및 적응 연구(식물)

진화 역사를 밝히고 환경적 도전에 대한 식물 적응의 유전적 메커니즘을 규명합니다.

유전자원 발굴

가치 있는 화합물과 혁신적인 농업 형질을 결정하는 새로운 유전자를 발굴하여 농업 및 생명공학 분야의 혁신을 촉진합니다.

유전자원 발굴

가치 있는 화합물과 혁신적인 농업 형질을 결정하는 새로운 유전자를 발굴하여 농업 및 생명공학 분야의 혁신을 촉진합니다.

세부사항

샘플 준비방법

샘플 양은 참고용으로만 제시됩니다. 자세한 내용은 샘플 요구사항을 다운로드하여 확인하십시오. 맞춤형 요청에 대한 자세한 내용은 문의하기를 통해 연락해 주십시오.

Platform TypeSample TypeAmount (Qubit®)Purity
Illumina NovaSeq SystemGenomic DNA≥ 200 ngOD260/280=1.8-2.0;
no degradation,
no contamination
PacBio Revio SystemHMW Genomic DNA≥ 3.5 μgOD260/280=1.75~2.0;
OD260/230=1.5~2.6;
*NC/QC=1.00~2.20;
Fragments should be ≥30K
Nanopore PromethIONHMW Genomic DNA≥ 8.5 μgOD260/280=1.75~2.0;
OD260/230=1.4~2.6;
*NC/QC=0.95~3.00
Fragments should be ≥30K
Nanopore PromethION
(Nanopore Ultra-long DNA Library)
uHMW Genomic DNA≥ 20 μgOD260/280=1.7-2.0;
OD260/230=1.3-2.6;
*NC/QC=0.95-3.00;
Fragments should be ≥ 100k, no fragments below 30k.
*NC/QC = NanoDrop concentration/Qubit concentration

샘플 준비방법

샘플 양은 참고용으로만 제시됩니다. 자세한 내용은 샘플 요구사항을 다운로드하여 확인하십시오. 맞춤형 요청에 대한 자세한 내용은 문의하기를 통해 연락해 주십시오.

Platform TypeSample TypeAmount (Qubit®)Purity
Illumina NovaSeq SystemGenomic DNA≥ 200 ngOD260/280=1.8-2.0;
no degradation,
no contamination
PacBio Revio SystemHMW Genomic DNA≥ 3.5 μgOD260/280=1.75~2.0;
OD260/230=1.5~2.6;
*NC/QC=1.00~2.20;
Fragments should be ≥30K
Nanopore PromethIONHMW Genomic DNA≥ 8.5 μgOD260/280=1.75~2.0;
OD260/230=1.4~2.6;
*NC/QC=0.95~3.00
Fragments should be ≥30K
Nanopore PromethION
(Nanopore Ultra-long DNA Library)
uHMW Genomic DNA≥ 20 μgOD260/280=1.7-2.0;
OD260/230=1.3-2.6;
*NC/QC=0.95-3.00;
Fragments should be ≥ 100k, no fragments below 30k.
*NC/QC = NanoDrop concentration/Qubit concentration

샘플 준비방법

샘플 양은 참고용으로만 제시됩니다. 자세한 내용은 샘플 요구사항을 다운로드하여 확인하십시오. 맞춤형 요청에 대한 자세한 내용은 문의하기를 통해 연락해 주십시오.

Platform TypeSample TypeAmount (Qubit®)Purity
Illumina NovaSeq SystemGenomic DNA≥ 200 ngOD260/280=1.8-2.0;
no degradation,
no contamination
PacBio Revio SystemHMW Genomic DNA≥ 3.5 μgOD260/280=1.75~2.0;
OD260/230=1.5~2.6;
*NC/QC=1.00~2.20;
Fragments should be ≥30K
Nanopore PromethIONHMW Genomic DNA≥ 8.5 μgOD260/280=1.75~2.0;
OD260/230=1.4~2.6;
*NC/QC=0.95~3.00
Fragments should be ≥30K
Nanopore PromethION
(Nanopore Ultra-long DNA Library)
uHMW Genomic DNA≥ 20 μgOD260/280=1.7-2.0;
OD260/230=1.3-2.6;
*NC/QC=0.95-3.00;
Fragments should be ≥ 100k, no fragments below 30k.
*NC/QC = NanoDrop concentration/Qubit concentration

샘플 준비방법

샘플 양은 참고용으로만 제시됩니다. 자세한 내용은 샘플 요구사항을 다운로드하여 확인하십시오. 맞춤형 요청에 대한 자세한 내용은 문의하기를 통해 연락해 주십시오.

Platform TypeSample TypeAmount (Qubit®)Purity
Illumina NovaSeq SystemGenomic DNA≥ 200 ngOD260/280=1.8-2.0;
no degradation,
no contamination
PacBio Revio SystemHMW Genomic DNA≥ 3.5 μgOD260/280=1.75~2.0;
OD260/230=1.5~2.6;
*NC/QC=1.00~2.20;
Fragments should be ≥30K
Nanopore PromethIONHMW Genomic DNA≥ 8.5 μgOD260/280=1.75~2.0;
OD260/230=1.4~2.6;
*NC/QC=0.95~3.00
Fragments should be ≥30K
Nanopore PromethION
(Nanopore Ultra-long DNA Library)
uHMW Genomic DNA≥ 20 μgOD260/280=1.7-2.0;
OD260/230=1.3-2.6;
*NC/QC=0.95-3.00;
Fragments should be ≥ 100k, no fragments below 30k.
*NC/QC = NanoDrop concentration/Qubit concentration

시퀀싱 & 데이터 분석

표시된 권장 데이터 산출량과 분석 내용은 참고용으로만 제공됩니다. 맞춤형 요청에 대한 자세한 내용은 문의하기를 통해 연락해 주십시오.linebreak

Sequencing TypeIllumina NovaSeq SystemPacBio Revio SystemNanopore PromethION System
Read LengthPaired-end 150 bpN50>15 kbAverage > 50 kb
Recommended  Sequencing DepthFor genome survey or assembly polishing: ≥ 50×
RNA requires 4 to 6 different tissue sites.
For genome assembly: ≥ 30×
Standard AnalysisK-mer analysis
GC content analysis
Repeat content rate evaluation
Heterozygous rate evaluation
Genome size evaluation
Long-read assembly
Assembly statistics
Gene completeness evaluation
Genome Annotation-Repeat prediction
Structure prediction
Function prediction
Noncoding RNA prediction

프로젝트 워크플로우

프로젝트 워크플로우

시퀀싱 & 데이터 분석

표시된 권장 데이터 산출량과 분석 내용은 참고용으로만 제공됩니다. 맞춤형 요청에 대한 자세한 내용은 문의하기를 통해 연락해 주십시오.linebreak

Sequencing TypeIllumina NovaSeq SystemPacBio Revio SystemNanopore PromethION System
Read LengthPaired-end 150 bpN50>15 kbAverage > 50 kb
Recommended  Sequencing DepthFor genome survey or assembly polishing: ≥ 50×
RNA requires 4 to 6 different tissue sites.
For genome assembly: ≥ 30×
Standard AnalysisK-mer analysis
GC content analysis
Repeat content rate evaluation
Heterozygous rate evaluation
Genome size evaluation
Long-read assembly
Assembly statistics
Gene completeness evaluation
Genome Annotation-Repeat prediction
Structure prediction
Function prediction
Noncoding RNA prediction

프로젝트 워크플로우

프로젝트 워크플로우

시퀀싱 & 데이터 분석

표시된 권장 데이터 산출량과 분석 내용은 참고용으로만 제공됩니다. 맞춤형 요청에 대한 자세한 내용은 문의하기를 통해 연락해 주십시오.linebreak

Sequencing TypeIllumina NovaSeq SystemPacBio Revio SystemNanopore PromethION System
Read LengthPaired-end 150 bpN50>15 kbAverage > 50 kb
Recommended  Sequencing DepthFor genome survey or assembly polishing: ≥ 50×
RNA requires 4 to 6 different tissue sites.
For genome assembly: ≥ 30×
Standard AnalysisK-mer analysis
GC content analysis
Repeat content rate evaluation
Heterozygous rate evaluation
Genome size evaluation
Long-read assembly
Assembly statistics
Gene completeness evaluation
Genome Annotation-Repeat prediction
Structure prediction
Function prediction
Noncoding RNA prediction

프로젝트 워크플로우

프로젝트 워크플로우

시퀀싱 & 데이터 분석

표시된 권장 데이터 산출량과 분석 내용은 참고용으로만 제공됩니다. 맞춤형 요청에 대한 자세한 내용은 문의하기를 통해 연락해 주십시오.linebreak

Sequencing TypeIllumina NovaSeq SystemPacBio Revio SystemNanopore PromethION System
Read LengthPaired-end 150 bpN50>15 kbAverage > 50 kb
Recommended  Sequencing DepthFor genome survey or assembly polishing: ≥ 50×
RNA requires 4 to 6 different tissue sites.
For genome assembly: ≥ 30×
Standard AnalysisK-mer analysis
GC content analysis
Repeat content rate evaluation
Heterozygous rate evaluation
Genome size evaluation
Long-read assembly
Assembly statistics
Gene completeness evaluation
Genome Annotation-Repeat prediction
Structure prediction
Function prediction
Noncoding RNA prediction

프로젝트 워크플로우

프로젝트 워크플로우

세부사항

샘플 준비방법

샘플 양은 참고용으로만 제시됩니다. 자세한 내용은 샘플 요구사항을 다운로드하여 확인하십시오. 맞춤형 요청에 대한 자세한 내용은 문의하기를 통해 연락해 주십시오.

Platform TypeSample TypeAmount (Qubit®)Purity
Illumina NovaSeq SystemGenomic DNA≥ 200 ngOD260/280=1.8-2.0;
no degradation,
no contamination
PacBio Revio SystemHMW Genomic DNA≥ 3.5 μgOD260/280=1.75~2.0;
OD260/230=1.5~2.6;
*NC/QC=1.00~2.20;
Fragments should be ≥30K
Nanopore PromethIONHMW Genomic DNA≥ 8.5 μgOD260/280=1.75~2.0;
OD260/230=1.4~2.6;
*NC/QC=0.95~3.00
Fragments should be ≥30K
Nanopore PromethION
(Nanopore Ultra-long DNA Library)
uHMW Genomic DNA≥ 20 μgOD260/280=1.7-2.0;
OD260/230=1.3-2.6;
*NC/QC=0.95-3.00;
Fragments should be ≥ 100k, no fragments below 30k.
*NC/QC = NanoDrop concentration/Qubit concentration

샘플 준비방법

샘플 양은 참고용으로만 제시됩니다. 자세한 내용은 샘플 요구사항을 다운로드하여 확인하십시오. 맞춤형 요청에 대한 자세한 내용은 문의하기를 통해 연락해 주십시오.

Platform TypeSample TypeAmount (Qubit®)Purity
Illumina NovaSeq SystemGenomic DNA≥ 200 ngOD260/280=1.8-2.0;
no degradation,
no contamination
PacBio Revio SystemHMW Genomic DNA≥ 3.5 μgOD260/280=1.75~2.0;
OD260/230=1.5~2.6;
*NC/QC=1.00~2.20;
Fragments should be ≥30K
Nanopore PromethIONHMW Genomic DNA≥ 8.5 μgOD260/280=1.75~2.0;
OD260/230=1.4~2.6;
*NC/QC=0.95~3.00
Fragments should be ≥30K
Nanopore PromethION
(Nanopore Ultra-long DNA Library)
uHMW Genomic DNA≥ 20 μgOD260/280=1.7-2.0;
OD260/230=1.3-2.6;
*NC/QC=0.95-3.00;
Fragments should be ≥ 100k, no fragments below 30k.
*NC/QC = NanoDrop concentration/Qubit concentration

샘플 준비방법

샘플 양은 참고용으로만 제시됩니다. 자세한 내용은 샘플 요구사항을 다운로드하여 확인하십시오. 맞춤형 요청에 대한 자세한 내용은 문의하기를 통해 연락해 주십시오.

Platform TypeSample TypeAmount (Qubit®)Purity
Illumina NovaSeq SystemGenomic DNA≥ 200 ngOD260/280=1.8-2.0;
no degradation,
no contamination
PacBio Revio SystemHMW Genomic DNA≥ 3.5 μgOD260/280=1.75~2.0;
OD260/230=1.5~2.6;
*NC/QC=1.00~2.20;
Fragments should be ≥30K
Nanopore PromethIONHMW Genomic DNA≥ 8.5 μgOD260/280=1.75~2.0;
OD260/230=1.4~2.6;
*NC/QC=0.95~3.00
Fragments should be ≥30K
Nanopore PromethION
(Nanopore Ultra-long DNA Library)
uHMW Genomic DNA≥ 20 μgOD260/280=1.7-2.0;
OD260/230=1.3-2.6;
*NC/QC=0.95-3.00;
Fragments should be ≥ 100k, no fragments below 30k.
*NC/QC = NanoDrop concentration/Qubit concentration

샘플 준비방법

샘플 양은 참고용으로만 제시됩니다. 자세한 내용은 샘플 요구사항을 다운로드하여 확인하십시오. 맞춤형 요청에 대한 자세한 내용은 문의하기를 통해 연락해 주십시오.

Platform TypeSample TypeAmount (Qubit®)Purity
Illumina NovaSeq SystemGenomic DNA≥ 200 ngOD260/280=1.8-2.0;
no degradation,
no contamination
PacBio Revio SystemHMW Genomic DNA≥ 3.5 μgOD260/280=1.75~2.0;
OD260/230=1.5~2.6;
*NC/QC=1.00~2.20;
Fragments should be ≥30K
Nanopore PromethIONHMW Genomic DNA≥ 8.5 μgOD260/280=1.75~2.0;
OD260/230=1.4~2.6;
*NC/QC=0.95~3.00
Fragments should be ≥30K
Nanopore PromethION
(Nanopore Ultra-long DNA Library)
uHMW Genomic DNA≥ 20 μgOD260/280=1.7-2.0;
OD260/230=1.3-2.6;
*NC/QC=0.95-3.00;
Fragments should be ≥ 100k, no fragments below 30k.
*NC/QC = NanoDrop concentration/Qubit concentration

시퀀싱 & 데이터 분석

표시된 권장 데이터 산출량과 분석 내용은 참고용으로만 제공됩니다. 맞춤형 요청에 대한 자세한 내용은 문의하기를 통해 연락해 주십시오.linebreak

Sequencing TypeIllumina NovaSeq SystemPacBio Revio SystemNanopore PromethION System
Read LengthPaired-end 150 bpN50>15 kbAverage > 50 kb
Recommended  Sequencing DepthFor genome survey or assembly polishing: ≥ 50×
RNA requires 4 to 6 different tissue sites.
For genome assembly: ≥ 30×
Standard AnalysisK-mer analysis
GC content analysis
Repeat content rate evaluation
Heterozygous rate evaluation
Genome size evaluation
Long-read assembly
Assembly statistics
Gene completeness evaluation
Genome Annotation-Repeat prediction
Structure prediction
Function prediction
Noncoding RNA prediction

프로젝트 워크플로우

프로젝트 워크플로우

시퀀싱 & 데이터 분석

표시된 권장 데이터 산출량과 분석 내용은 참고용으로만 제공됩니다. 맞춤형 요청에 대한 자세한 내용은 문의하기를 통해 연락해 주십시오.linebreak

Sequencing TypeIllumina NovaSeq SystemPacBio Revio SystemNanopore PromethION System
Read LengthPaired-end 150 bpN50>15 kbAverage > 50 kb
Recommended  Sequencing DepthFor genome survey or assembly polishing: ≥ 50×
RNA requires 4 to 6 different tissue sites.
For genome assembly: ≥ 30×
Standard AnalysisK-mer analysis
GC content analysis
Repeat content rate evaluation
Heterozygous rate evaluation
Genome size evaluation
Long-read assembly
Assembly statistics
Gene completeness evaluation
Genome Annotation-Repeat prediction
Structure prediction
Function prediction
Noncoding RNA prediction

프로젝트 워크플로우

프로젝트 워크플로우

시퀀싱 & 데이터 분석

표시된 권장 데이터 산출량과 분석 내용은 참고용으로만 제공됩니다. 맞춤형 요청에 대한 자세한 내용은 문의하기를 통해 연락해 주십시오.linebreak

Sequencing TypeIllumina NovaSeq SystemPacBio Revio SystemNanopore PromethION System
Read LengthPaired-end 150 bpN50>15 kbAverage > 50 kb
Recommended  Sequencing DepthFor genome survey or assembly polishing: ≥ 50×
RNA requires 4 to 6 different tissue sites.
For genome assembly: ≥ 30×
Standard AnalysisK-mer analysis
GC content analysis
Repeat content rate evaluation
Heterozygous rate evaluation
Genome size evaluation
Long-read assembly
Assembly statistics
Gene completeness evaluation
Genome Annotation-Repeat prediction
Structure prediction
Function prediction
Noncoding RNA prediction

프로젝트 워크플로우

프로젝트 워크플로우

시퀀싱 & 데이터 분석

표시된 권장 데이터 산출량과 분석 내용은 참고용으로만 제공됩니다. 맞춤형 요청에 대한 자세한 내용은 문의하기를 통해 연락해 주십시오.linebreak

Sequencing TypeIllumina NovaSeq SystemPacBio Revio SystemNanopore PromethION System
Read LengthPaired-end 150 bpN50>15 kbAverage > 50 kb
Recommended  Sequencing DepthFor genome survey or assembly polishing: ≥ 50×
RNA requires 4 to 6 different tissue sites.
For genome assembly: ≥ 30×
Standard AnalysisK-mer analysis
GC content analysis
Repeat content rate evaluation
Heterozygous rate evaluation
Genome size evaluation
Long-read assembly
Assembly statistics
Gene completeness evaluation
Genome Annotation-Repeat prediction
Structure prediction
Function prediction
Noncoding RNA prediction

프로젝트 워크플로우

프로젝트 워크플로우

데이터 분석 예시

Image
Image
1/1
조립 통계

곡물진딧물 유전체의 A/T/G/C 함량 통계

Image
Image
1/1
조립 평가 - BUSCO 평가

BUSCO 평가 결과

참고: C: 완전한 BUSCO; S: 완전한 단일 사본 BUSCO; D: 완전한 중복 BUSCO; F: 단편화된 BUSCO; M: 누락된 BUSCO; n: 검색된 전체 BUSCO 그룹 수

Image
Image
1/1
GC 함량 및 깊이 분포

x축: GC 함량; y축: 시퀀싱 깊이.

상단: GC 함량 분포.

오른쪽 하단: 시퀀싱 깊이 분포.

Image
Image
1/1
근거 지원

유전자 세트 근거 지원의 벤 다이어그램입니다. Augustus, GlimmerHMM, SNAP, Geneid 및 Genscan은 De novo 유전자 구조 예측에 사용됩니다.

Image
Image
1/1
기능 예측

유전자 기능 주석의 벤 다이어그램입니다. 유전자 구조를 통해 예측된 단백질 서열을 알려진 단백질 데이터베이스와 정렬합니다. 결과에 따르면 유전자의 95.8%에 대한 기능을 예측할 수 있었습니다.

Image
Image
1/1
조립 통계

곡물진딧물 유전체의 A/T/G/C 함량 통계

Image
Image
1/1
조립 평가 - BUSCO 평가

BUSCO 평가 결과

참고: C: 완전한 BUSCO; S: 완전한 단일 사본 BUSCO; D: 완전한 중복 BUSCO; F: 단편화된 BUSCO; M: 누락된 BUSCO; n: 검색된 전체 BUSCO 그룹 수

Image
Image
1/1
GC 함량 및 깊이 분포

x축: GC 함량; y축: 시퀀싱 깊이.

상단: GC 함량 분포.

오른쪽 하단: 시퀀싱 깊이 분포.

Image
Image
1/1
근거 지원

유전자 세트 근거 지원의 벤 다이어그램입니다. Augustus, GlimmerHMM, SNAP, Geneid 및 Genscan은 De novo 유전자 구조 예측에 사용됩니다.

Image
Image
1/1
기능 예측

유전자 기능 주석의 벤 다이어그램입니다. 유전자 구조를 통해 예측된 단백질 서열을 알려진 단백질 데이터베이스와 정렬합니다. 결과에 따르면 유전자의 95.8%에 대한 기능을 예측할 수 있었습니다.

데이터 분석 예시

Image
Image
1/1
조립 통계

곡물진딧물 유전체의 A/T/G/C 함량 통계

Image
Image
1/1
조립 평가 - BUSCO 평가

BUSCO 평가 결과

참고: C: 완전한 BUSCO; S: 완전한 단일 사본 BUSCO; D: 완전한 중복 BUSCO; F: 단편화된 BUSCO; M: 누락된 BUSCO; n: 검색된 전체 BUSCO 그룹 수

Image
Image
1/1
GC 함량 및 깊이 분포

x축: GC 함량; y축: 시퀀싱 깊이.

상단: GC 함량 분포.

오른쪽 하단: 시퀀싱 깊이 분포.

Image
Image
1/1
근거 지원

유전자 세트 근거 지원의 벤 다이어그램입니다. Augustus, GlimmerHMM, SNAP, Geneid 및 Genscan은 De novo 유전자 구조 예측에 사용됩니다.

Image
Image
1/1
기능 예측

유전자 기능 주석의 벤 다이어그램입니다. 유전자 구조를 통해 예측된 단백질 서열을 알려진 단백질 데이터베이스와 정렬합니다. 결과에 따르면 유전자의 95.8%에 대한 기능을 예측할 수 있었습니다.

Image
Image
1/1
조립 통계

곡물진딧물 유전체의 A/T/G/C 함량 통계

Image
Image
1/1
조립 평가 - BUSCO 평가

BUSCO 평가 결과

참고: C: 완전한 BUSCO; S: 완전한 단일 사본 BUSCO; D: 완전한 중복 BUSCO; F: 단편화된 BUSCO; M: 누락된 BUSCO; n: 검색된 전체 BUSCO 그룹 수

Image
Image
1/1
GC 함량 및 깊이 분포

x축: GC 함량; y축: 시퀀싱 깊이.

상단: GC 함량 분포.

오른쪽 하단: 시퀀싱 깊이 분포.

Image
Image
1/1
근거 지원

유전자 세트 근거 지원의 벤 다이어그램입니다. Augustus, GlimmerHMM, SNAP, Geneid 및 Genscan은 De novo 유전자 구조 예측에 사용됩니다.

Image
Image
1/1
기능 예측

유전자 기능 주석의 벤 다이어그램입니다. 유전자 구조를 통해 예측된 단백질 서열을 알려진 단백질 데이터베이스와 정렬합니다. 결과에 따르면 유전자의 95.8%에 대한 기능을 예측할 수 있었습니다.

K-mer 분석

Kmer=17 분석 및 유전체 크기 평가

SampleKmerDepthn_kmerGenome_size(M)Genome_size(M)Genome_size(M)Repeat_rate(%)
plant173624,079,467,724668.87668.87668.8773
(1) K-mer: Selected K-mer length.
(2) Depth:The expected value of K-mer depth.
(3) n_K-mer:The total number of K-mer from SOAPdenovo.
(4) Genome size(M):The genome size in Mb estimated by formula: Genome Size=K-mer_num/Peak_depth.
(5) Revise Genome size(M):Revised genome size after error correction from wrong K-mer.
(6) Heteozygous ratio:The percent of heteozygous positions.
(7) Repeat:Calculated by the percentage of K-mer numbers after 1.8-fold of the main peak of total K-mer numbers.
Note: The repeat here is a mathematically repeated sequence but not a repeat element with certain biological functions.
SampleKmerDepthn_kmerGenome_size(M)Genome_size(M)Genome_size(M)Repeat_rate(%)
plant173624,079,467,724668.87668.87668.8773
(1) K-mer: Selected K-mer length.
(2) Depth:The expected value of K-mer depth.
(3) n_K-mer:The total number of K-mer from SOAPdenovo.
(4) Genome size(M):The genome size in Mb estimated by formula: Genome Size=K-mer_num/Peak_depth.
(5) Revise Genome size(M):Revised genome size after error correction from wrong K-mer.
(6) Heteozygous ratio:The percent of heteozygous positions.
(7) Repeat:Calculated by the percentage of K-mer numbers after 1.8-fold of the main peak of total K-mer numbers.
Note: The repeat here is a mathematically repeated sequence but not a repeat element with certain biological functions.
SampleKmerDepthn_kmerGenome_size(M)Genome_size(M)Genome_size(M)Repeat_rate(%)
plant173624,079,467,724668.87668.87668.8773
(1) K-mer: Selected K-mer length.
(2) Depth:The expected value of K-mer depth.
(3) n_K-mer:The total number of K-mer from SOAPdenovo.
(4) Genome size(M):The genome size in Mb estimated by formula: Genome Size=K-mer_num/Peak_depth.
(5) Revise Genome size(M):Revised genome size after error correction from wrong K-mer.
(6) Heteozygous ratio:The percent of heteozygous positions.
(7) Repeat:Calculated by the percentage of K-mer numbers after 1.8-fold of the main peak of total K-mer numbers.
Note: The repeat here is a mathematically repeated sequence but not a repeat element with certain biological functions.
SampleKmerDepthn_kmerGenome_size(M)Genome_size(M)Genome_size(M)Repeat_rate(%)
plant173624,079,467,724668.87668.87668.8773
(1) K-mer: Selected K-mer length.
(2) Depth:The expected value of K-mer depth.
(3) n_K-mer:The total number of K-mer from SOAPdenovo.
(4) Genome size(M):The genome size in Mb estimated by formula: Genome Size=K-mer_num/Peak_depth.
(5) Revise Genome size(M):Revised genome size after error correction from wrong K-mer.
(6) Heteozygous ratio:The percent of heteozygous positions.
(7) Repeat:Calculated by the percentage of K-mer numbers after 1.8-fold of the main peak of total K-mer numbers.
Note: The repeat here is a mathematically repeated sequence but not a repeat element with certain biological functions.

K-mer 분석

Kmer=17 분석 및 유전체 크기 평가

SampleKmerDepthn_kmerGenome_size(M)Genome_size(M)Genome_size(M)Repeat_rate(%)
plant173624,079,467,724668.87668.87668.8773
(1) K-mer: Selected K-mer length.
(2) Depth:The expected value of K-mer depth.
(3) n_K-mer:The total number of K-mer from SOAPdenovo.
(4) Genome size(M):The genome size in Mb estimated by formula: Genome Size=K-mer_num/Peak_depth.
(5) Revise Genome size(M):Revised genome size after error correction from wrong K-mer.
(6) Heteozygous ratio:The percent of heteozygous positions.
(7) Repeat:Calculated by the percentage of K-mer numbers after 1.8-fold of the main peak of total K-mer numbers.
Note: The repeat here is a mathematically repeated sequence but not a repeat element with certain biological functions.
SampleKmerDepthn_kmerGenome_size(M)Genome_size(M)Genome_size(M)Repeat_rate(%)
plant173624,079,467,724668.87668.87668.8773
(1) K-mer: Selected K-mer length.
(2) Depth:The expected value of K-mer depth.
(3) n_K-mer:The total number of K-mer from SOAPdenovo.
(4) Genome size(M):The genome size in Mb estimated by formula: Genome Size=K-mer_num/Peak_depth.
(5) Revise Genome size(M):Revised genome size after error correction from wrong K-mer.
(6) Heteozygous ratio:The percent of heteozygous positions.
(7) Repeat:Calculated by the percentage of K-mer numbers after 1.8-fold of the main peak of total K-mer numbers.
Note: The repeat here is a mathematically repeated sequence but not a repeat element with certain biological functions.
SampleKmerDepthn_kmerGenome_size(M)Genome_size(M)Genome_size(M)Repeat_rate(%)
plant173624,079,467,724668.87668.87668.8773
(1) K-mer: Selected K-mer length.
(2) Depth:The expected value of K-mer depth.
(3) n_K-mer:The total number of K-mer from SOAPdenovo.
(4) Genome size(M):The genome size in Mb estimated by formula: Genome Size=K-mer_num/Peak_depth.
(5) Revise Genome size(M):Revised genome size after error correction from wrong K-mer.
(6) Heteozygous ratio:The percent of heteozygous positions.
(7) Repeat:Calculated by the percentage of K-mer numbers after 1.8-fold of the main peak of total K-mer numbers.
Note: The repeat here is a mathematically repeated sequence but not a repeat element with certain biological functions.
SampleKmerDepthn_kmerGenome_size(M)Genome_size(M)Genome_size(M)Repeat_rate(%)
plant173624,079,467,724668.87668.87668.8773
(1) K-mer: Selected K-mer length.
(2) Depth:The expected value of K-mer depth.
(3) n_K-mer:The total number of K-mer from SOAPdenovo.
(4) Genome size(M):The genome size in Mb estimated by formula: Genome Size=K-mer_num/Peak_depth.
(5) Revise Genome size(M):Revised genome size after error correction from wrong K-mer.
(6) Heteozygous ratio:The percent of heteozygous positions.
(7) Repeat:Calculated by the percentage of K-mer numbers after 1.8-fold of the main peak of total K-mer numbers.
Note: The repeat here is a mathematically repeated sequence but not a repeat element with certain biological functions.

자주 묻는 질문

조립 결과의 신뢰성을 어떻게 보장할 수 있나요? 조립의 완전성과 정확성을 평가하는 주요 방법은 무엇인가요?

Contig N50 및 Scaffold N50 지표를 확보하는 것 외에도 조립 품질을 평가하는 것이 중요합니다. 일반적인 평가 방법으로는 BUSCO, LAI, Merqury, CEGMA, EST 서열 평가, RNA 서열 평가 및 컨센서스 평가가 있습니다. 이 중 BUSCO는 단일 사본 상동 유전자 라이브러리를 사용하여 유전체를 평가하고, LAI는 긴 말단 반복 역전이인자를 기반으로 유전체 완전성을 평가하며, Merqury는 유전체의 QV(Quality Value)를 평가합니다. 현재 이 세 가지 평가 방법이 가장 널리 사용되고 있습니다.

De novo 조립에 권장되는 전략은 무엇인가요?

Survey와 Genome De Novo에 동일한 DNA가 필요한가요?

다른 서비스 탐색

Total RNA seq
(Total RNA seq)
Total RNA seq
(Total RNA seq)
Full-length 전사체 시퀀싱
(Full-length 전사체 시퀀싱)
Full-length 전사체 시퀀싱
(Full-length 전사체 시퀀싱)
PAWGS
(PAWGS)
PAWGS
(PAWGS)

다른 서비스 탐색

Total RNA seq
(Total RNA seq)
Total RNA seq
(Total RNA seq)
Full-length 전사체 시퀀싱
(Full-length 전사체 시퀀싱)
Full-length 전사체 시퀀싱
(Full-length 전사체 시퀀싱)
PAWGS
(PAWGS)
PAWGS
(PAWGS)
Background
Background

프로젝트를 시작할 준비가 되셨나요?

문의 내용을 보내주시면 Novogene 전문가가 연락드리겠습니다.


Privacy PolicyCookie Policy