
Novogene Korea
  • Novogene Korea
  • Genomics
    • Human Whole Genome Sequencing
    • Plant & Animal Whole Genome Sequencing
    • Microbial Whole Genome Sequencing
    • Whole Exome Sequencing
    • Plant & Animal De novo Sequencing
    • Microbial De novo Sequencing
    • Amplicon Sequencing
    • Shotgun Metagenomics Sequencing
    Transcriptomics
    • mRNA Sequencing
    • Total RNA Sequencing
    • Full-Length Transcriptome Sequencing
    • Whole Transcriptome Sequencing
    • Small RNA Sequencing
    • Circular RNA Sequencing
    • Metatranscriptome Sequencing
    • Prokaryotic RNA Sequencing
    Single Cell & Spatial Omics
    • Single Cell Gene Expression
    • Single Cell Immune Profiling Sequencing
    • Single Cell Long Read Transcriptome
    • Visium HD Spatial Gene Expression
    • Stereo-Seq Spatial Gene Expression
    • Xenium In Situ Spatial Transcriptome
    Epigenomics
    • Whole Genome Bisulfite Sequencing (WGBS)
    • Directed DNA Methylation Sequencing (DM-Seq) NEW
    • Reduced Representation Bisulfite Sequencing (RRBS)
    • Chromatin Immunoprecipitation Sequencing (ChIP-seq)
    • RNA Immunoprecipitation Sequencing (RIP-seq)
    • Assay for Transposase-Accessible Chromatin with Sequencing (ATAC-seq)

    Premade Library

    • Sequencing Only (Illumina 플랫폼)
    • Sequencing Only (PacBio 플랫폼)
    Proteomics & Metabolomics
    • Olink Proteomics
    • Quantitative Proteomics (MS)
    • Untargeted Metabolomics (MS)
  • 프로모션프로모션
    • 플랫폼
    • 자동화 운송 플랫폼 (Falcon)
    • BI 분석툴 (NovoMagic)
    • Customer Service System (CSS)
    • 브로셔
    • 케이스 스터디
    • 웨비나
    • 블로그
    • 샘플준비 가이드라인
    • 커뮤니티
    • 암 연구
    • 면역 종양학
    • 농업
    • 환경
    • 식품
    • 인간 마이크로바이옴
    • 동물 & 식물 마이크로바이옴
    • 신약개발
    • 희귀 질환 연구
    • 회사소개
    • 글로벌 입지
    • 뉴스룸
    • 채용 정보
  • 문의하기문의하기
  1. Home
  2. Resources
  3. Blog
  4. How to employ statistical approaches to identify differentially expressed genes (DEG)

How to employ statistical approaches to identify differentially expressed genes (DEG)

Identifying differentially expressed genes (DEGs) is an important task in genetic research because it allows researchers to identify genes that are associated with a particular phenotype or condition of interest. DEGs are genes that show significant differences in expression levels between two or more groups, such as a disease group and a healthy control group. The identification of DEGs can have a variety of significant ramifications, including:

1.Understanding disease mechanisms: DEGs can provide insights into the molecular mechanisms underlying a particular disease or phenotype. 2.Biomarker discovery: DEGs can also be used as biomarkers for diagnosis or prognosis of a disease. 3.Personalized medicine: DEGs can also be used to identify patient subgroups that may respond differently to a particular treatment. 4.Drug development: DEGs can also be used as targets for drug development.

The identification of DEGs is a critical step in genetic research as it allows researchers to gain insights into the molecular mechanisms underlying a particular phenotype or condition and potentially identify new targets for diagnosis, treatment, and drug development.

Adopted Statistical methods for DEGs identification

In simple words, if some changes in gene expression levels are observed between two experimental conditions or we see a statistically significant difference in the read counts, it is indicated as Differential gene expression (DEG). we can say that checking the difference in the mean value of gene expression under different conditions, is sufficient. However, practically expression of gene mostly has a normal distribution. It is not easy to determine the differential gene expression by a simple comparison of means and variance.
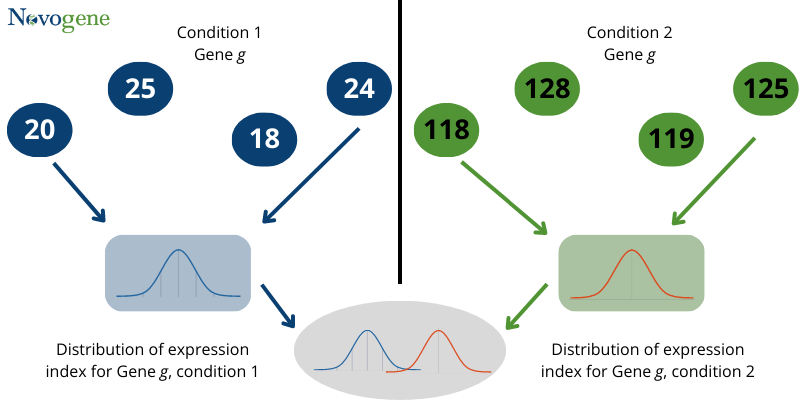
Fig1: Distribution of differential expression statistic

Therefore, in order to identify the difference in gene expression between two conditions, it is crucial to find the statistical distribution properties. These statistical distribution properties can be used to approximate the differentially expressed genes. Parameters like p-value, p-adjust, q-value and other indicators are used to determine whether a gene has differential expression or if there is a false positive error. p-value or probability-value describes how likely you can find a particular set of observations, if the null hypothesis of the data was true. p-adjust value is the adjustment made to correct P-values. q-value is a value used to determine False Discovery Rate (FDR); q-value attempts to control the percentage of false positives among a collection of scores.

For example, sometimes there are many 0 values in the read counts of transcripts of our samples. This situation will have an impact on the reliability of p-value, because most of the times the p-value will be significant. However, we can’t say that this is always very realistic. In this case we need to correct the p-value. The p-adjust value is calculated first to correct the p-value. Although the details of the complete correction process are not discussed here, we can simply say that to determine the credibility of p-value, the parameter used is p-adjust. It comes from the p-value, but it is more credible relative to the p-value. In conclusion, we know that when both p-value and p-adjust are available, we should choose p-adjust to be used as the threshold of significance, as it is more credible.

The corrected p-value is used to determine the significance of gene difference, between two samples. The smaller the corrected p-value, the more significant the difference. We can also use |log2Foldchange| to determine the size of the difference. The larger the |log2Foldchange|, the greater is the difference multiplicity. However, the screening of differential genes is based on statistical significance. It is not logical to judge whether a gene is differential or not by the size of two values. (1) Firstly, the read counts of some samples are affected by the depth of sequencing. The read counts may be higher due to the sequencing depth. (2) Secondly, during the analysis of variance, the distribution of read counts need to be estimated. The analysis of previous experience shows that read counts obey the negative binomial distribution. In the case of replicates, their quality also has an impact on the difference between genes. If the replicates are poor, the within-group variation (variation due to error) will mask out some of the between-group variation (variation due to the factor). After the parameter’s estimation, a specific test is needed to determine whether the difference is genetic or not. (3) As explained earlier, after the calculation of p-value, it needs to be corrected by multiple hypothesis testing to reduce false positives.
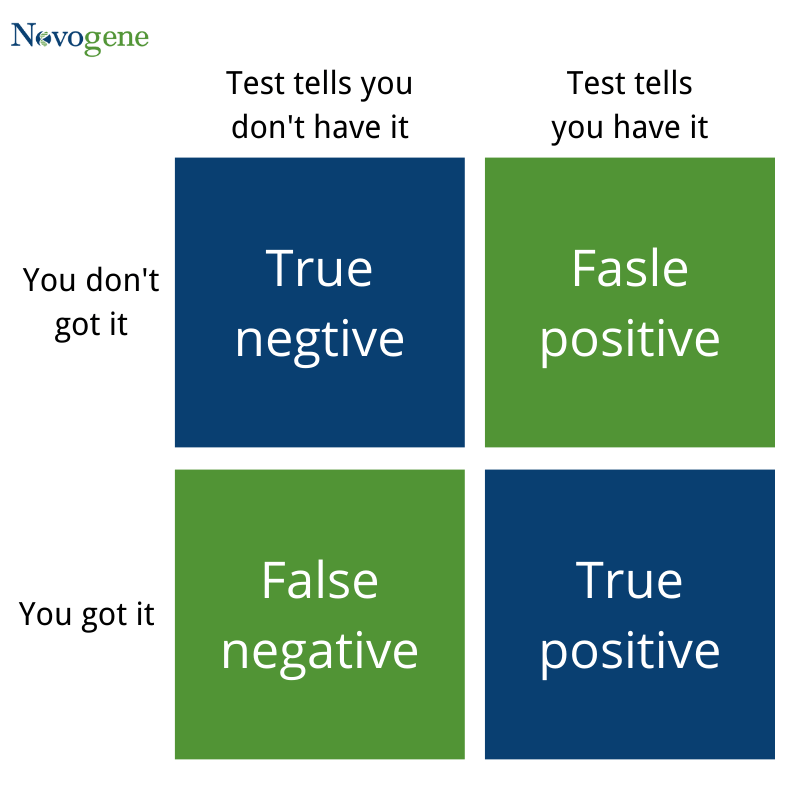
Fig 2: False positives and false negatives 1.(False Positive): rejecting the null hypothesis when it is true 2.(False Negative): accepting the null hypothesis when it is false

In the multiple hypothesis testing process, the q-value is the expected value of the number of false rejections (rejection of the true hypothesis (null hypothesis). It is a proportion of all rejected hypotheses (which represents the error rate) in the multiple hypothesis testing process. q-value can be defined as the probability of false positives for p-value, when q-value < 0.05, the significant false positive for p-value is less than 0.05. To summarize we can say that both the p-value and q-value are statistical test variables. For any gene difference, the lowers the p-value/q-value, the lower will be the probability of a false positive result and the higher will be the reliability. However, q-value is more stringent than p-value. When the number of differential gene results is low, p-value based screening can be used as a second-best option. On the other hand, the q-value based screening may filter out a small number of different genes. However, comparing to the majority of false positives and the small probability of true positives, the loss of all these true positives is not very important.

서비스서비스 menu

고객지원고객지원 menu

기업정보기업정보 menu

서비스
WGSDe novo SeqAmplicon SeqShotgun MetagenomeDM-SeqmRNA-SeqSingle Cell Gene ExpressionVisium HDXenium In SituOlinkUntargeted Metabolomics
고객지원
노보매직CSSFalcon 플랫폼
기업정보
회사소개글로벌 입지플랫폼뉴스룸채용 정보문의하기
LinkedInLinkedIn hoverYouTubeYouTube hoverXX hoverMetaMeta hoverInstagramInstagram hover
Copyright © 2026 Novogene Co., Ltd. All Rights Reserved. 노보진의 한국 내 모든 서비스는 연구 목적 (Research Use Only, RUO) 으로만 제공됩니다. 사업자등록번호: 494-86-03792 | 판매자번호: 노보진코리아유한회사 | 대표자명: 리휘시앙 | 사업자주소: 서울시 강서구 마곡동 779-1번지 뉴브클라우드힐스 BT-230, 231호, 07790 | 전화번호: 02-2038-8036
Novogene Korea
  • Novogene Korea
  • Genomics
    • Human Whole Genome Sequencing
    • Plant & Animal Whole Genome Sequencing
    • Microbial Whole Genome Sequencing
    • Whole Exome Sequencing
    • Plant & Animal De novo Sequencing
    • Microbial De novo Sequencing
    • Amplicon Sequencing
    • Shotgun Metagenomics Sequencing
    Transcriptomics
    • mRNA Sequencing
    • Total RNA Sequencing
    • Full-Length Transcriptome Sequencing
    • Whole Transcriptome Sequencing
    • Small RNA Sequencing
    • Circular RNA Sequencing
    • Metatranscriptome Sequencing
    • Prokaryotic RNA Sequencing
    Single Cell & Spatial Omics
    • Single Cell Gene Expression
    • Single Cell Immune Profiling Sequencing
    • Single Cell Long Read Transcriptome
    • Visium HD Spatial Gene Expression
    • Stereo-Seq Spatial Gene Expression
    • Xenium In Situ Spatial Transcriptome
    Epigenomics
    • Whole Genome Bisulfite Sequencing (WGBS)
    • Directed DNA Methylation Sequencing (DM-Seq) NEW
    • Reduced Representation Bisulfite Sequencing (RRBS)
    • Chromatin Immunoprecipitation Sequencing (ChIP-seq)
    • RNA Immunoprecipitation Sequencing (RIP-seq)
    • Assay for Transposase-Accessible Chromatin with Sequencing (ATAC-seq)

    Premade Library

    • Sequencing Only (Illumina 플랫폼)
    • Sequencing Only (PacBio 플랫폼)
    Proteomics & Metabolomics
    • Olink Proteomics
    • Quantitative Proteomics (MS)
    • Untargeted Metabolomics (MS)
  • 프로모션프로모션
    • 플랫폼
    • 자동화 운송 플랫폼 (Falcon)
    • BI 분석툴 (NovoMagic)
    • Customer Service System (CSS)
    • 브로셔
    • 케이스 스터디
    • 웨비나
    • 블로그
    • 샘플준비 가이드라인
    • 커뮤니티
    • 암 연구
    • 면역 종양학
    • 농업
    • 환경
    • 식품
    • 인간 마이크로바이옴
    • 동물 & 식물 마이크로바이옴
    • 신약개발
    • 희귀 질환 연구
    • 회사소개
    • 글로벌 입지
    • 뉴스룸
    • 채용 정보
  • 문의하기문의하기
  1. Home
  2. Resources
  3. Blog
  4. How to employ statistical approaches to identify differentially expressed genes (DEG)

How to employ statistical approaches to identify differentially expressed genes (DEG)

Identifying differentially expressed genes (DEGs) is an important task in genetic research because it allows researchers to identify genes that are associated with a particular phenotype or condition of interest. DEGs are genes that show significant differences in expression levels between two or more groups, such as a disease group and a healthy control group. The identification of DEGs can have a variety of significant ramifications, including:

1.Understanding disease mechanisms: DEGs can provide insights into the molecular mechanisms underlying a particular disease or phenotype. 2.Biomarker discovery: DEGs can also be used as biomarkers for diagnosis or prognosis of a disease. 3.Personalized medicine: DEGs can also be used to identify patient subgroups that may respond differently to a particular treatment. 4.Drug development: DEGs can also be used as targets for drug development.

The identification of DEGs is a critical step in genetic research as it allows researchers to gain insights into the molecular mechanisms underlying a particular phenotype or condition and potentially identify new targets for diagnosis, treatment, and drug development.

Adopted Statistical methods for DEGs identification

In simple words, if some changes in gene expression levels are observed between two experimental conditions or we see a statistically significant difference in the read counts, it is indicated as Differential gene expression (DEG). we can say that checking the difference in the mean value of gene expression under different conditions, is sufficient. However, practically expression of gene mostly has a normal distribution. It is not easy to determine the differential gene expression by a simple comparison of means and variance.

Fig1: Distribution of differential expression statistic

Therefore, in order to identify the difference in gene expression between two conditions, it is crucial to find the statistical distribution properties. These statistical distribution properties can be used to approximate the differentially expressed genes. Parameters like p-value, p-adjust, q-value and other indicators are used to determine whether a gene has differential expression or if there is a false positive error. p-value or probability-value describes how likely you can find a particular set of observations, if the null hypothesis of the data was true. p-adjust value is the adjustment made to correct P-values. q-value is a value used to determine False Discovery Rate (FDR); q-value attempts to control the percentage of false positives among a collection of scores.

For example, sometimes there are many 0 values in the read counts of transcripts of our samples. This situation will have an impact on the reliability of p-value, because most of the times the p-value will be significant. However, we can’t say that this is always very realistic. In this case we need to correct the p-value. The p-adjust value is calculated first to correct the p-value. Although the details of the complete correction process are not discussed here, we can simply say that to determine the credibility of p-value, the parameter used is p-adjust. It comes from the p-value, but it is more credible relative to the p-value. In conclusion, we know that when both p-value and p-adjust are available, we should choose p-adjust to be used as the threshold of significance, as it is more credible.

The corrected p-value is used to determine the significance of gene difference, between two samples. The smaller the corrected p-value, the more significant the difference. We can also use |log2Foldchange| to determine the size of the difference. The larger the |log2Foldchange|, the greater is the difference multiplicity. However, the screening of differential genes is based on statistical significance. It is not logical to judge whether a gene is differential or not by the size of two values. (1) Firstly, the read counts of some samples are affected by the depth of sequencing. The read counts may be higher due to the sequencing depth. (2) Secondly, during the analysis of variance, the distribution of read counts need to be estimated. The analysis of previous experience shows that read counts obey the negative binomial distribution. In the case of replicates, their quality also has an impact on the difference between genes. If the replicates are poor, the within-group variation (variation due to error) will mask out some of the between-group variation (variation due to the factor). After the parameter’s estimation, a specific test is needed to determine whether the difference is genetic or not. (3) As explained earlier, after the calculation of p-value, it needs to be corrected by multiple hypothesis testing to reduce false positives.

Fig 2: False positives and false negatives 1.(False Positive): rejecting the null hypothesis when it is true 2.(False Negative): accepting the null hypothesis when it is false

In the multiple hypothesis testing process, the q-value is the expected value of the number of false rejections (rejection of the true hypothesis (null hypothesis). It is a proportion of all rejected hypotheses (which represents the error rate) in the multiple hypothesis testing process. q-value can be defined as the probability of false positives for p-value, when q-value < 0.05, the significant false positive for p-value is less than 0.05. To summarize we can say that both the p-value and q-value are statistical test variables. For any gene difference, the lowers the p-value/q-value, the lower will be the probability of a false positive result and the higher will be the reliability. However, q-value is more stringent than p-value. When the number of differential gene results is low, p-value based screening can be used as a second-best option. On the other hand, the q-value based screening may filter out a small number of different genes. However, comparing to the majority of false positives and the small probability of true positives, the loss of all these true positives is not very important.

서비스서비스 menu

고객지원고객지원 menu

기업정보기업정보 menu

서비스
WGSDe novo SeqAmplicon SeqShotgun MetagenomeDM-SeqmRNA-SeqSingle Cell Gene ExpressionVisium HDXenium In SituOlinkUntargeted Metabolomics
고객지원
노보매직CSSFalcon 플랫폼
기업정보
회사소개글로벌 입지플랫폼뉴스룸채용 정보문의하기
LinkedInLinkedIn hoverYouTubeYouTube hoverXX hoverMetaMeta hoverInstagramInstagram hover
Copyright © 2026 Novogene Co., Ltd. All Rights Reserved. 노보진의 한국 내 모든 서비스는 연구 목적 (Research Use Only, RUO) 으로만 제공됩니다. 사업자등록번호: 494-86-03792 | 판매자번호: 노보진코리아유한회사 | 대표자명: 리휘시앙 | 사업자주소: 서울시 강서구 마곡동 779-1번지 뉴브클라우드힐스 BT-230, 231호, 07790 | 전화번호: 02-2038-8036
Privacy PolicyCookie Policy