
Novogene Korea
  • Novogene Korea
  • Genomics
    • Human Whole Genome Sequencing
    • Plant & Animal Whole Genome Sequencing
    • Microbial Whole Genome Sequencing
    • Whole Exome Sequencing
    • Plant & Animal De novo Sequencing
    • Microbial De novo Sequencing
    • Amplicon Sequencing
    • Shotgun Metagenomics Sequencing
    Transcriptomics
    • mRNA Sequencing
    • Total RNA Sequencing
    • Full-Length Transcriptome Sequencing
    • Whole Transcriptome Sequencing
    • Small RNA Sequencing
    • Circular RNA Sequencing
    • Metatranscriptome Sequencing
    • Prokaryotic RNA Sequencing
    Single Cell & Spatial Omics
    • Single Cell Gene Expression
    • Single Cell Immune Profiling Sequencing
    • Single Cell Long Read Transcriptome
    • Visium HD Spatial Gene Expression
    • Stereo-Seq Spatial Gene Expression
    • Xenium In Situ Spatial Transcriptome
    Epigenomics
    • Whole Genome Bisulfite Sequencing (WGBS)
    • Directed DNA Methylation Sequencing (DM-Seq) NEW
    • Reduced Representation Bisulfite Sequencing (RRBS)
    • Chromatin Immunoprecipitation Sequencing (ChIP-seq)
    • RNA Immunoprecipitation Sequencing (RIP-seq)
    • Assay for Transposase-Accessible Chromatin with Sequencing (ATAC-seq)

    Premade Library

    • Sequencing Only (Illumina 플랫폼)
    • Sequencing Only (PacBio 플랫폼)
    Proteomics & Metabolomics
    • Olink Proteomics
    • Quantitative Proteomics (MS)
    • Untargeted Metabolomics (MS)
  • 프로모션프로모션
    • 플랫폼
    • 자동화 운송 플랫폼 (Falcon)
    • BI 분석툴 (NovoMagic)
    • Customer Service System (CSS)
    • 브로셔
    • 케이스 스터디
    • 웨비나
    • 블로그
    • 샘플준비 가이드라인
    • 커뮤니티
    • 암 연구
    • 면역 종양학
    • 농업
    • 환경
    • 식품
    • 인간 마이크로바이옴
    • 동물 & 식물 마이크로바이옴
    • 신약개발
    • 희귀 질환 연구
    • 회사소개
    • 글로벌 입지
    • 뉴스룸
    • 채용 정보
  • 문의하기문의하기
  1. Home
  2. Resources
  3. Blog
  4. GEO data mining (III) - Gene pathway enrichment analysis with complete code sharing

GEO data mining (III) - Gene pathway enrichment analysis with complete code sharing

The previous tutorials in our GEO data mining series have shared the steps of downloading data, “GEO Data Mining (I) “” and “” and the steps of gene variance analysis, “GEO Data Mining (II) – Differential gene expression analysis and visualization”. In this article, we will share code necessary for performing pathway enrichment analysis of the extracted genes whose differential expression has been examined.

Using the earlier tutorials, we have already identified differentially expressed genes. However, that information is not fully complete. Because there are many gene categories, the biological significance of a set of differentially expressed genes may not always be obvious. Enrichment analysis examines whether a set of genes is more significant at a certain functional node compared to a random level and extending from simple annotation of a single gene to the analysis of grouped ness of multiple gene sets. Enrichment analysis can be useful for annotating the function of genes of interest, such as differentially expressed genes, and analyzing which gene set they are most enriched in, and what types of regulation they are involved in, thus affecting the occurrence of diseases. The most common enrichment methods used today are Gene Ontology (GO) and KEGG (Kyoto Encyclopedia of Genes and Genomes) pathway enrichment analyses to reveal the biological context represented by a class of genes.

GO term functional enrichment analysis

The Gene Ontology (GO) database is one of the most widely used gene pathway annotation systems. Its principle is simply to calculate whether differential genes involved in regulatory processes are significantly clustered in three levels: cellular component (CC), molecular function (MF), and biological process (BP).

“Cellular component” describes a specific cellular structure whereby the gene product performs its function. For example, a product protein may be localized in the nucleus or in the ribosome. Molecular function describes the activity of the gene product at the molecular level, such as catalysis or transport. Biological process describes a biological function with which a gene product is associated, or a large biological activity accomplished by the activity of multiple molecules. Examples include mitosis or purine metabolism. The code below will help you perform GO on your sample.

##import related R package rm(list = ls()) load(“step4_output.Rdata”) library(clusterProfiler) library(dplyr) library(ggplot2) source(“kegg_plot_function.R”) #(1)input data gene_up = deg[deg$change == ‘up’,’ENTREZID’] gene_down = deg[deg$change == ‘down’,’ENTREZID’] gene_diff = c(gene_up,gene_down) gene_all = deg[,’ENTREZID’]

#(2) GO analysis, in three parts library(org.Hs.eg.db) if(T){ # Cellular component (CC) ego_CC <- enrichGO(gene = gene_diff, OrgDb= org.Hs.eg.db, ont = “CC”, pAdjustMethod = “BH”, minGSSize = 1, pvalueCutoff = 0.01, qvalueCutoff = 0.01, readable = TRUE) # Biological process (BP). ego_BP <- enrichGO(gene = gene_diff, OrgDb= org.Hs.eg.db, ont = “BP”, pAdjustMethod = “BH”, minGSSize = 1, pvalueCutoff = 0.01, qvalueCutoff = 0.01, readable = TRUE) # Molecular function (MF): ego_MF <- enrichGO(gene = gene_diff, OrgDb= org.Hs.eg.db, ont = “MF”, pAdjustMethod = “BH”, minGSSize = 1, pvalueCutoff = 0.01, qvalueCutoff = 0.01, readable = TRUE) save(ego_CC,ego_BP,ego_MF,file = “ego_GSE42872.Rdata”) } load(file = “ego_GSE42872.Rdata”)

#(3) Visualization #Strip Chart barplot(ego_CC,showCategory=20) #bubble plot dotplot(ego_CC) geneList = deg$logFC names(geneList)=deg$ENTREZID geneList = sort(geneList,decreasing = T) #(4) Demonstration of common genes in the top5 pathway #Gene-Concept Network cnetplot(ego_CC, categorySize=”pvalue”, foldChange=geneList,colorEdge = TRUE) cnetplot(ego_CC, foldChange=geneList, circular = TRUE, colorEdge = TRUE) #Enrichment Map emapplot(ego_CC) #(5) Demonstrate access relationships goplot(ego_CC) #(6)Heatmap-like functional classification heatplot(ego_CC,foldChange = geneList) pdf(“heatplot.pdf”,width = 14,height = 5) heatplot(ego_CC,foldChange = geneList) dev.off()
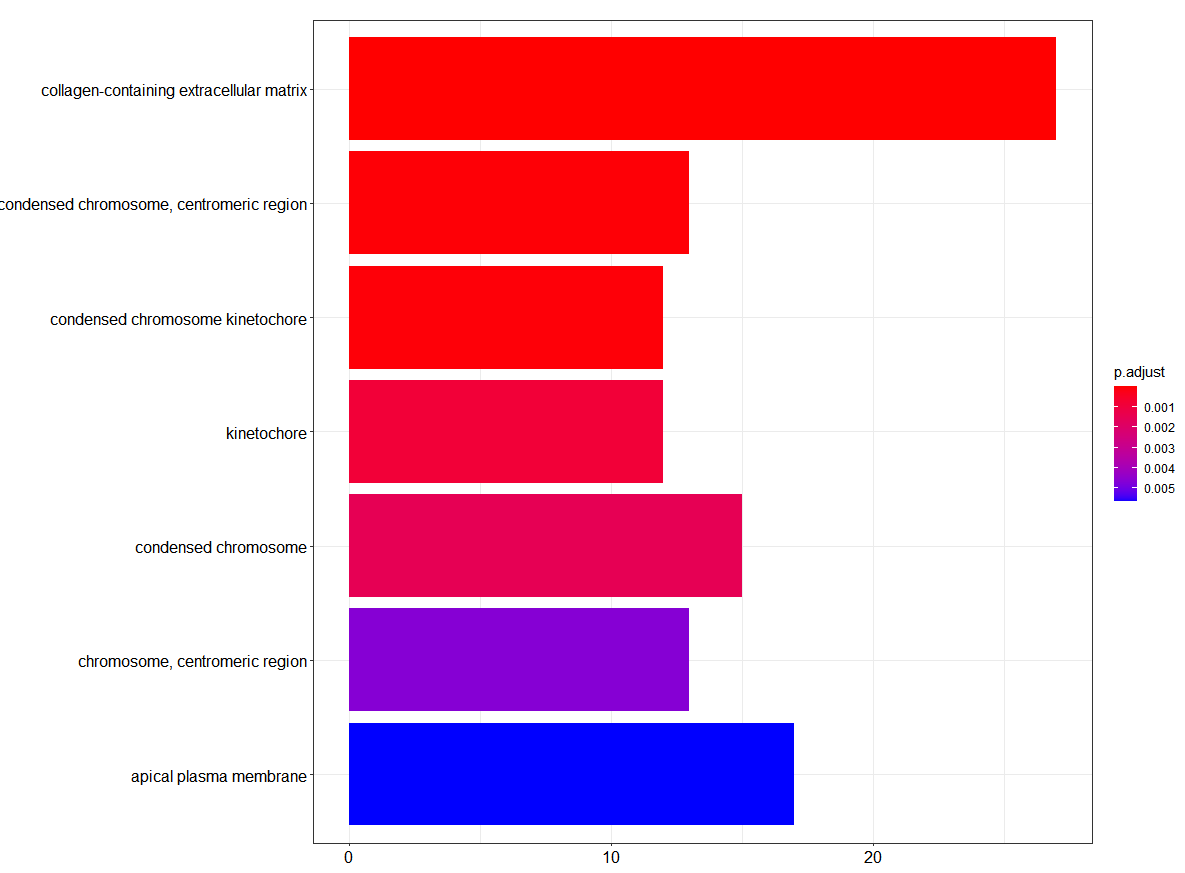
Histogram of GO Pathway enrichment analysis
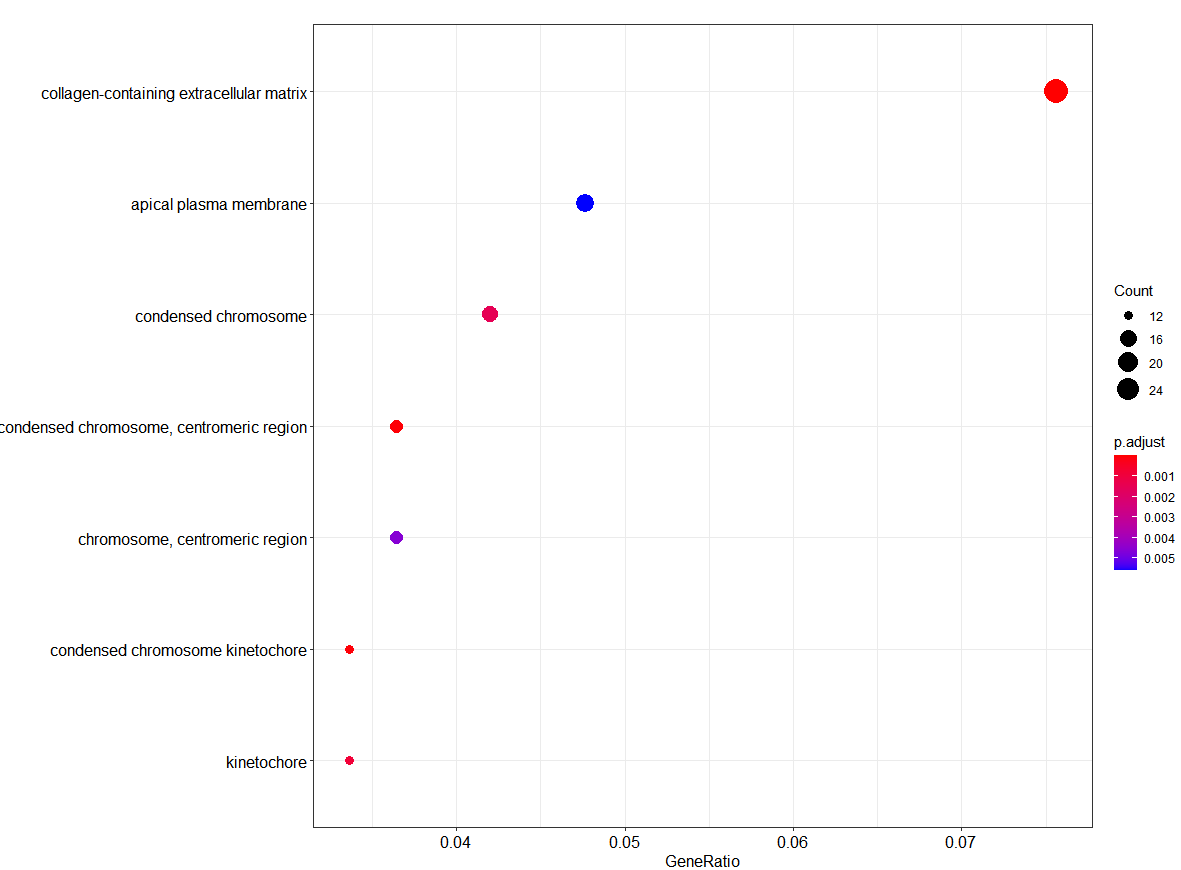
Bubble plot of GO Pathway enrichment analysis
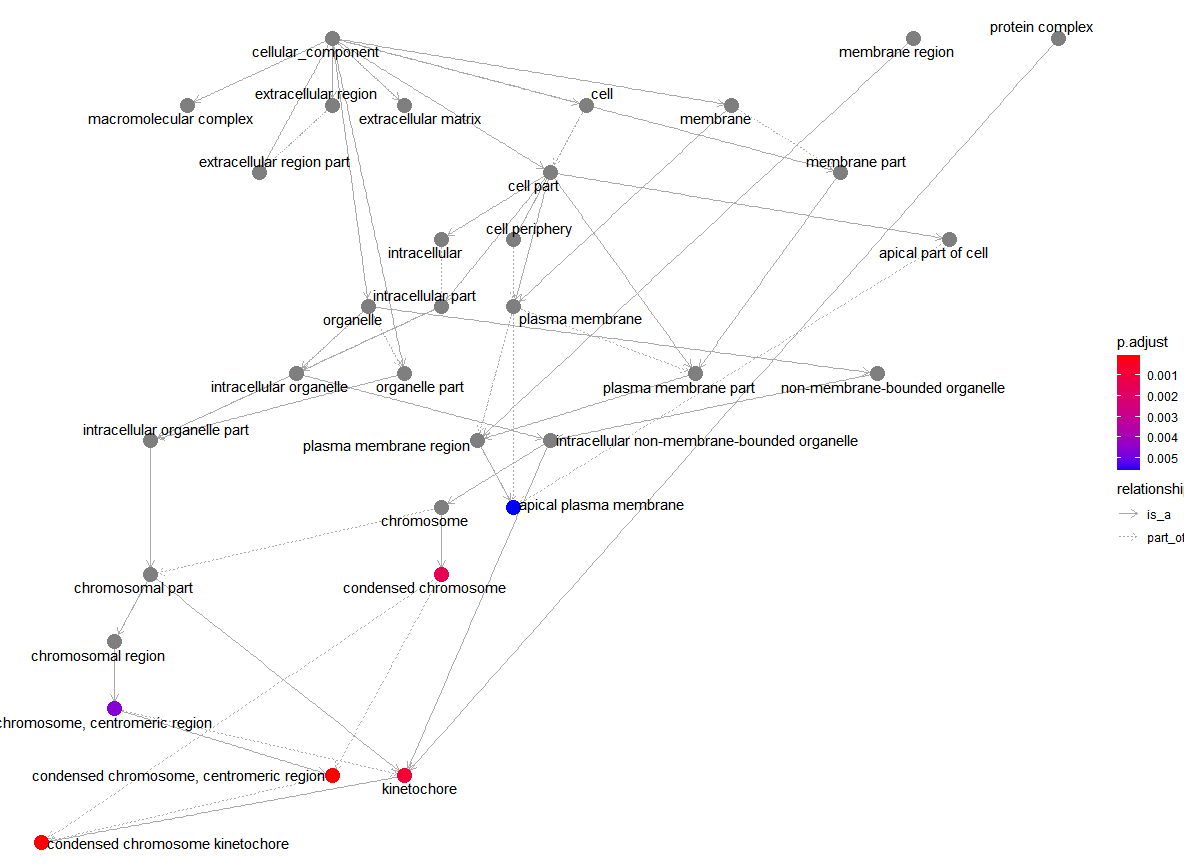
Access Relationships of GO Pathway enrichment analysis

KEGG enrichment analysis

KEGG pathway enrichment uses its own database for systematic analysis of gene function and genomic information, integrating information from genomics, biochemistry and systemic function, which helps us to study gene and expression information as a whole. Each KEGG pathway map contains a network of molecular interactions and reactions that link genes to pathways in gene products. Pathway analysis is useful for identifying the biological context of cellular and organismal metabolism as well as various other functions. The code below will help you perform GO on your sample.

#Up-regulation, down-regulation, difference, all genes #(1) Input data gene_up = deg[deg$change == ‘up’,’ENTREZID’] gene_down = deg[deg$change == ‘down’,’ENTREZID’] gene_diff = c(gene_up,gene_down) gene_all = deg[,’ENTREZID’]

#(2)Enrichment analysis of upregulated/downregulated/all differential genes if(T){ kk.up <- enrichKEGG(gene = gene_up, organism = ‘hsa’, universe = gene_all, pvalueCutoff = 0.9, qvalueCutoff = 0.9) kk.down <- enrichKEGG(gene = gene_down, organism = ‘hsa’, universe = gene_all, pvalueCutoff = 0.9, qvalueCutoff =0.9) kk.diff <- enrichKEGG(gene = gene_diff, organism = ‘hsa’, pvalueCutoff = 0.9) save(kk.diff,kk.down,kk.up,file = “GSE21933kegg.Rdata”) } load(“GSE21933kegg.Rdata”)

#(3) Extract the resulting data frame from the enrichment results kegg_diff_dt <- kk.diff@result

#(4) Filter pathways by pvalue down_kegg <- kk.down@result %>% filter(pvalue<0.05) %>% mutate(group=-1) up_kegg <- kk.up@result %>% filter(pvalue<0.05) %>% mutate(group=1)

#(5) Visualization g_kegg <- kegg_plot(up_kegg,down_kegg)

#g_kegg +scale_y_continuous(labels = c(20,15,10,5,0,5)) ggsave(g_kegg,filename = ‘kegg_up_down.png’)
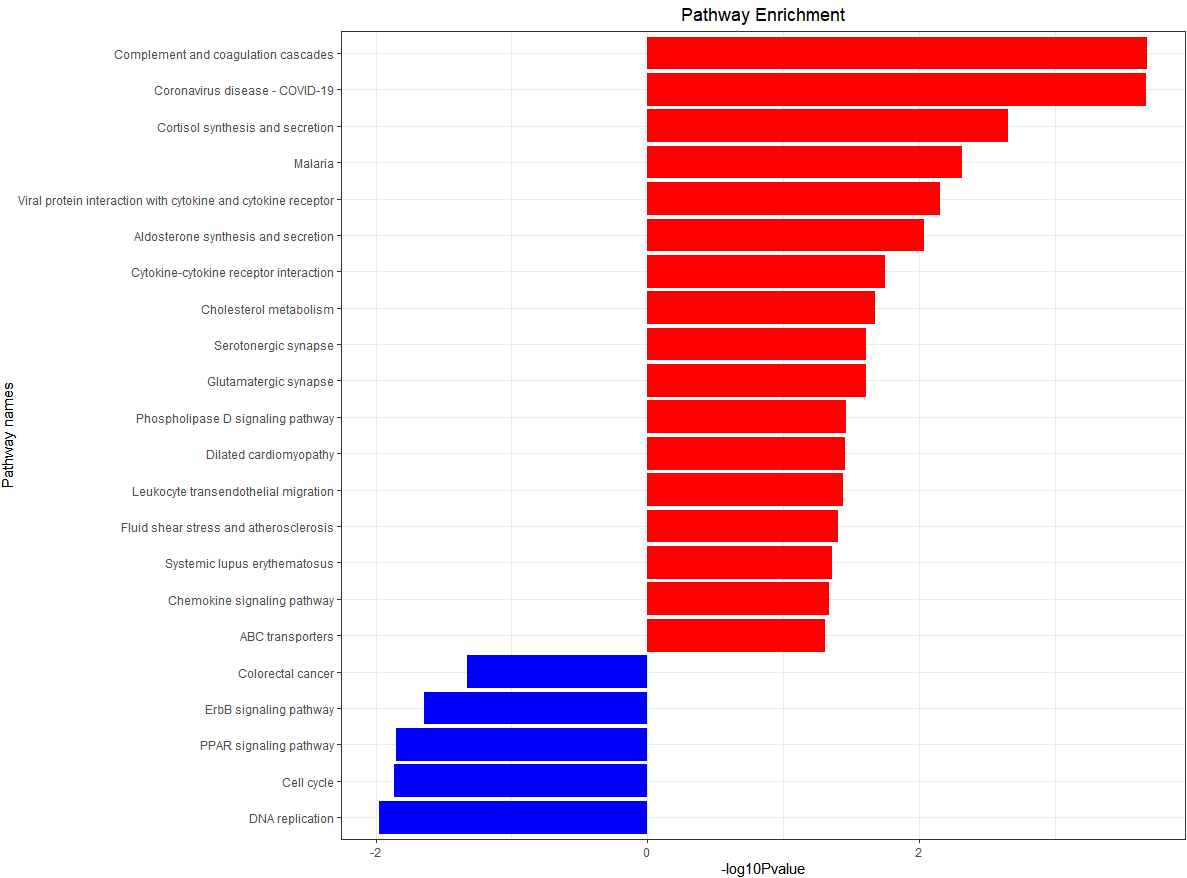
KEGG enrichment analysis histogram

Data mining of GEO database enables investigators to analyze differential expression, identify novel relationships or activities, extract significant conclusions, and build frameworks for new avenues of study. Investigators who are used to traditional work on coding genes can use the GEO datasets to enrich their studies with non-coding genes and explore DNA regulatory elements. If the sequencing depth from the GEO datasets is very deep, trans-shearing can be studied to mine potential circular RNAs. The original sequencing data can be analyzed from scratch to explore new genes. Therefore, data mining of GEO database enables investigators to explore gene functions and pathways expansively and in greater detail. The “GEO data mining” series has come to an end. In the future, we’ll produce more insightful series. Stay tuned!

서비스서비스 menu

고객지원고객지원 menu

기업정보기업정보 menu

서비스
WGSDe novo SeqAmplicon SeqShotgun MetagenomeDM-SeqmRNA-SeqSingle Cell Gene ExpressionVisium HDXenium In SituOlinkUntargeted Metabolomics
고객지원
노보매직CSSFalcon 플랫폼
기업정보
회사소개글로벌 입지플랫폼뉴스룸채용 정보문의하기
LinkedInLinkedIn hoverYouTubeYouTube hoverXX hoverMetaMeta hoverInstagramInstagram hover
Copyright © 2026 Novogene Co., Ltd. All Rights Reserved. 노보진의 한국 내 모든 서비스는 연구 목적 (Research Use Only, RUO) 으로만 제공됩니다. 사업자등록번호: 494-86-03792 | 판매자번호: 노보진코리아유한회사 | 대표자명: 리휘시앙 | 사업자주소: 서울시 강서구 마곡동 779-1번지 뉴브클라우드힐스 BT-230, 231호, 07790 | 전화번호: 02-2038-8036
Novogene Korea
  • Novogene Korea
  • Genomics
    • Human Whole Genome Sequencing
    • Plant & Animal Whole Genome Sequencing
    • Microbial Whole Genome Sequencing
    • Whole Exome Sequencing
    • Plant & Animal De novo Sequencing
    • Microbial De novo Sequencing
    • Amplicon Sequencing
    • Shotgun Metagenomics Sequencing
    Transcriptomics
    • mRNA Sequencing
    • Total RNA Sequencing
    • Full-Length Transcriptome Sequencing
    • Whole Transcriptome Sequencing
    • Small RNA Sequencing
    • Circular RNA Sequencing
    • Metatranscriptome Sequencing
    • Prokaryotic RNA Sequencing
    Single Cell & Spatial Omics
    • Single Cell Gene Expression
    • Single Cell Immune Profiling Sequencing
    • Single Cell Long Read Transcriptome
    • Visium HD Spatial Gene Expression
    • Stereo-Seq Spatial Gene Expression
    • Xenium In Situ Spatial Transcriptome
    Epigenomics
    • Whole Genome Bisulfite Sequencing (WGBS)
    • Directed DNA Methylation Sequencing (DM-Seq) NEW
    • Reduced Representation Bisulfite Sequencing (RRBS)
    • Chromatin Immunoprecipitation Sequencing (ChIP-seq)
    • RNA Immunoprecipitation Sequencing (RIP-seq)
    • Assay for Transposase-Accessible Chromatin with Sequencing (ATAC-seq)

    Premade Library

    • Sequencing Only (Illumina 플랫폼)
    • Sequencing Only (PacBio 플랫폼)
    Proteomics & Metabolomics
    • Olink Proteomics
    • Quantitative Proteomics (MS)
    • Untargeted Metabolomics (MS)
  • 프로모션프로모션
    • 플랫폼
    • 자동화 운송 플랫폼 (Falcon)
    • BI 분석툴 (NovoMagic)
    • Customer Service System (CSS)
    • 브로셔
    • 케이스 스터디
    • 웨비나
    • 블로그
    • 샘플준비 가이드라인
    • 커뮤니티
    • 암 연구
    • 면역 종양학
    • 농업
    • 환경
    • 식품
    • 인간 마이크로바이옴
    • 동물 & 식물 마이크로바이옴
    • 신약개발
    • 희귀 질환 연구
    • 회사소개
    • 글로벌 입지
    • 뉴스룸
    • 채용 정보
  • 문의하기문의하기
  1. Home
  2. Resources
  3. Blog
  4. GEO data mining (III) - Gene pathway enrichment analysis with complete code sharing

GEO data mining (III) - Gene pathway enrichment analysis with complete code sharing

The previous tutorials in our GEO data mining series have shared the steps of downloading data, “GEO Data Mining (I) “” and “” and the steps of gene variance analysis, “GEO Data Mining (II) – Differential gene expression analysis and visualization”. In this article, we will share code necessary for performing pathway enrichment analysis of the extracted genes whose differential expression has been examined.

Using the earlier tutorials, we have already identified differentially expressed genes. However, that information is not fully complete. Because there are many gene categories, the biological significance of a set of differentially expressed genes may not always be obvious. Enrichment analysis examines whether a set of genes is more significant at a certain functional node compared to a random level and extending from simple annotation of a single gene to the analysis of grouped ness of multiple gene sets. Enrichment analysis can be useful for annotating the function of genes of interest, such as differentially expressed genes, and analyzing which gene set they are most enriched in, and what types of regulation they are involved in, thus affecting the occurrence of diseases. The most common enrichment methods used today are Gene Ontology (GO) and KEGG (Kyoto Encyclopedia of Genes and Genomes) pathway enrichment analyses to reveal the biological context represented by a class of genes.

GO term functional enrichment analysis

The Gene Ontology (GO) database is one of the most widely used gene pathway annotation systems. Its principle is simply to calculate whether differential genes involved in regulatory processes are significantly clustered in three levels: cellular component (CC), molecular function (MF), and biological process (BP).

“Cellular component” describes a specific cellular structure whereby the gene product performs its function. For example, a product protein may be localized in the nucleus or in the ribosome. Molecular function describes the activity of the gene product at the molecular level, such as catalysis or transport. Biological process describes a biological function with which a gene product is associated, or a large biological activity accomplished by the activity of multiple molecules. Examples include mitosis or purine metabolism. The code below will help you perform GO on your sample.

##import related R package rm(list = ls()) load(“step4_output.Rdata”) library(clusterProfiler) library(dplyr) library(ggplot2) source(“kegg_plot_function.R”) #(1)input data gene_up = deg[deg$change == ‘up’,’ENTREZID’] gene_down = deg[deg$change == ‘down’,’ENTREZID’] gene_diff = c(gene_up,gene_down) gene_all = deg[,’ENTREZID’]

#(2) GO analysis, in three parts library(org.Hs.eg.db) if(T){ # Cellular component (CC) ego_CC <- enrichGO(gene = gene_diff, OrgDb= org.Hs.eg.db, ont = “CC”, pAdjustMethod = “BH”, minGSSize = 1, pvalueCutoff = 0.01, qvalueCutoff = 0.01, readable = TRUE) # Biological process (BP). ego_BP <- enrichGO(gene = gene_diff, OrgDb= org.Hs.eg.db, ont = “BP”, pAdjustMethod = “BH”, minGSSize = 1, pvalueCutoff = 0.01, qvalueCutoff = 0.01, readable = TRUE) # Molecular function (MF): ego_MF <- enrichGO(gene = gene_diff, OrgDb= org.Hs.eg.db, ont = “MF”, pAdjustMethod = “BH”, minGSSize = 1, pvalueCutoff = 0.01, qvalueCutoff = 0.01, readable = TRUE) save(ego_CC,ego_BP,ego_MF,file = “ego_GSE42872.Rdata”) } load(file = “ego_GSE42872.Rdata”)

#(3) Visualization #Strip Chart barplot(ego_CC,showCategory=20) #bubble plot dotplot(ego_CC) geneList = deg$logFC names(geneList)=deg$ENTREZID geneList = sort(geneList,decreasing = T) #(4) Demonstration of common genes in the top5 pathway #Gene-Concept Network cnetplot(ego_CC, categorySize=”pvalue”, foldChange=geneList,colorEdge = TRUE) cnetplot(ego_CC, foldChange=geneList, circular = TRUE, colorEdge = TRUE) #Enrichment Map emapplot(ego_CC) #(5) Demonstrate access relationships goplot(ego_CC) #(6)Heatmap-like functional classification heatplot(ego_CC,foldChange = geneList) pdf(“heatplot.pdf”,width = 14,height = 5) heatplot(ego_CC,foldChange = geneList) dev.off()

Histogram of GO Pathway enrichment analysis

Bubble plot of GO Pathway enrichment analysis

Access Relationships of GO Pathway enrichment analysis

KEGG enrichment analysis

KEGG pathway enrichment uses its own database for systematic analysis of gene function and genomic information, integrating information from genomics, biochemistry and systemic function, which helps us to study gene and expression information as a whole. Each KEGG pathway map contains a network of molecular interactions and reactions that link genes to pathways in gene products. Pathway analysis is useful for identifying the biological context of cellular and organismal metabolism as well as various other functions. The code below will help you perform GO on your sample.

#Up-regulation, down-regulation, difference, all genes #(1) Input data gene_up = deg[deg$change == ‘up’,’ENTREZID’] gene_down = deg[deg$change == ‘down’,’ENTREZID’] gene_diff = c(gene_up,gene_down) gene_all = deg[,’ENTREZID’]

#(2)Enrichment analysis of upregulated/downregulated/all differential genes if(T){ kk.up <- enrichKEGG(gene = gene_up, organism = ‘hsa’, universe = gene_all, pvalueCutoff = 0.9, qvalueCutoff = 0.9) kk.down <- enrichKEGG(gene = gene_down, organism = ‘hsa’, universe = gene_all, pvalueCutoff = 0.9, qvalueCutoff =0.9) kk.diff <- enrichKEGG(gene = gene_diff, organism = ‘hsa’, pvalueCutoff = 0.9) save(kk.diff,kk.down,kk.up,file = “GSE21933kegg.Rdata”) } load(“GSE21933kegg.Rdata”)

#(3) Extract the resulting data frame from the enrichment results kegg_diff_dt <- kk.diff@result

#(4) Filter pathways by pvalue down_kegg <- kk.down@result %>% filter(pvalue<0.05) %>% mutate(group=-1) up_kegg <- kk.up@result %>% filter(pvalue<0.05) %>% mutate(group=1)

#(5) Visualization g_kegg <- kegg_plot(up_kegg,down_kegg)

#g_kegg +scale_y_continuous(labels = c(20,15,10,5,0,5)) ggsave(g_kegg,filename = ‘kegg_up_down.png’)

KEGG enrichment analysis histogram

Data mining of GEO database enables investigators to analyze differential expression, identify novel relationships or activities, extract significant conclusions, and build frameworks for new avenues of study. Investigators who are used to traditional work on coding genes can use the GEO datasets to enrich their studies with non-coding genes and explore DNA regulatory elements. If the sequencing depth from the GEO datasets is very deep, trans-shearing can be studied to mine potential circular RNAs. The original sequencing data can be analyzed from scratch to explore new genes. Therefore, data mining of GEO database enables investigators to explore gene functions and pathways expansively and in greater detail. The “GEO data mining” series has come to an end. In the future, we’ll produce more insightful series. Stay tuned!

서비스서비스 menu

고객지원고객지원 menu

기업정보기업정보 menu

서비스
WGSDe novo SeqAmplicon SeqShotgun MetagenomeDM-SeqmRNA-SeqSingle Cell Gene ExpressionVisium HDXenium In SituOlinkUntargeted Metabolomics
고객지원
노보매직CSSFalcon 플랫폼
기업정보
회사소개글로벌 입지플랫폼뉴스룸채용 정보문의하기
LinkedInLinkedIn hoverYouTubeYouTube hoverXX hoverMetaMeta hoverInstagramInstagram hover
Copyright © 2026 Novogene Co., Ltd. All Rights Reserved. 노보진의 한국 내 모든 서비스는 연구 목적 (Research Use Only, RUO) 으로만 제공됩니다. 사업자등록번호: 494-86-03792 | 판매자번호: 노보진코리아유한회사 | 대표자명: 리휘시앙 | 사업자주소: 서울시 강서구 마곡동 779-1번지 뉴브클라우드힐스 BT-230, 231호, 07790 | 전화번호: 02-2038-8036
Privacy PolicyCookie Policy