
Novogene Korea
  • Novogene Korea
  • Genomics
    • Human Whole Genome Sequencing
    • Plant & Animal Whole Genome Sequencing
    • Microbial Whole Genome Sequencing
    • Whole Exome Sequencing
    • Plant & Animal De novo Sequencing
    • Microbial De novo Sequencing
    • Amplicon Sequencing
    • Shotgun Metagenomics Sequencing
    Transcriptomics
    • mRNA Sequencing
    • Total RNA Sequencing
    • Full-Length Transcriptome Sequencing
    • Whole Transcriptome Sequencing
    • Small RNA Sequencing
    • Circular RNA Sequencing
    • Metatranscriptome Sequencing
    • Prokaryotic RNA Sequencing
    Single Cell & Spatial Omics
    • Single Cell Gene Expression
    • Single Cell Immune Profiling Sequencing
    • Single Cell Long Read Transcriptome
    • Visium HD Spatial Gene Expression
    • Stereo-Seq Spatial Gene Expression
    • Xenium In Situ Spatial Transcriptome
    Epigenomics
    • Whole Genome Bisulfite Sequencing (WGBS)
    • Directed DNA Methylation Sequencing (DM-Seq) NEW
    • Reduced Representation Bisulfite Sequencing (RRBS)
    • Chromatin Immunoprecipitation Sequencing (ChIP-seq)
    • RNA Immunoprecipitation Sequencing (RIP-seq)
    • Assay for Transposase-Accessible Chromatin with Sequencing (ATAC-seq)

    Premade Library

    • Sequencing Only (Illumina 플랫폼)
    • Sequencing Only (PacBio 플랫폼)
    Proteomics & Metabolomics
    • Olink Proteomics
    • Quantitative Proteomics (MS)
    • Untargeted Metabolomics (MS)
  • 프로모션프로모션
    • 플랫폼
    • 자동화 운송 플랫폼 (Falcon)
    • BI 분석툴 (NovoMagic)
    • Customer Service System (CSS)
    • 브로셔
    • 케이스 스터디
    • 웨비나
    • 블로그
    • 샘플준비 가이드라인
    • 커뮤니티
    • 암 연구
    • 면역 종양학
    • 농업
    • 환경
    • 식품
    • 인간 마이크로바이옴
    • 동물 & 식물 마이크로바이옴
    • 신약개발
    • 희귀 질환 연구
    • 회사소개
    • 글로벌 입지
    • 뉴스룸
    • 채용 정보
  • 문의하기문의하기
  1. Home
  2. Resources
  3. Blog
  4. Gene Expression Omnibus Data Mining (IA): Quick and easy download of GEO data

Gene Expression Omnibus Data Mining (IA): Quick and easy download of GEO data

Data mining is a popular area of bioinformatics analysis. In general, “mining” refers to the acts of retrieving and gathering information from vast amounts of data in order to achieve particular study objectives. The Gene Expression Omnibus (GEO) database is a treasure trove of publicly available microarray and next-generation sequencing data, particularly transcription data. Data mining from GEO enables investigators to analyze differential expression, identify novel relationships or activities, extract significant conclusions, and build frameworks for new avenues of study.

This tutorial series describes the procedures and software tools needed to complete the main steps in the GEO data mining process:

  • Search datasets and download data
  • Generate expression matrix
  • Perform differential analysis
  • Identify and visualize differentially expressed genes
  • Proceed KEGG and GO enrichment analysis

We begin with the first step, downloading data from GEO. That data will be used subsequently to identify relevant genes and pathways. Initially, the goal is to locate the dataset used in a study of interest and download the corresponding GEO Platform (GPL) file with its expression matrix “series matrix” for gene expression analysis.
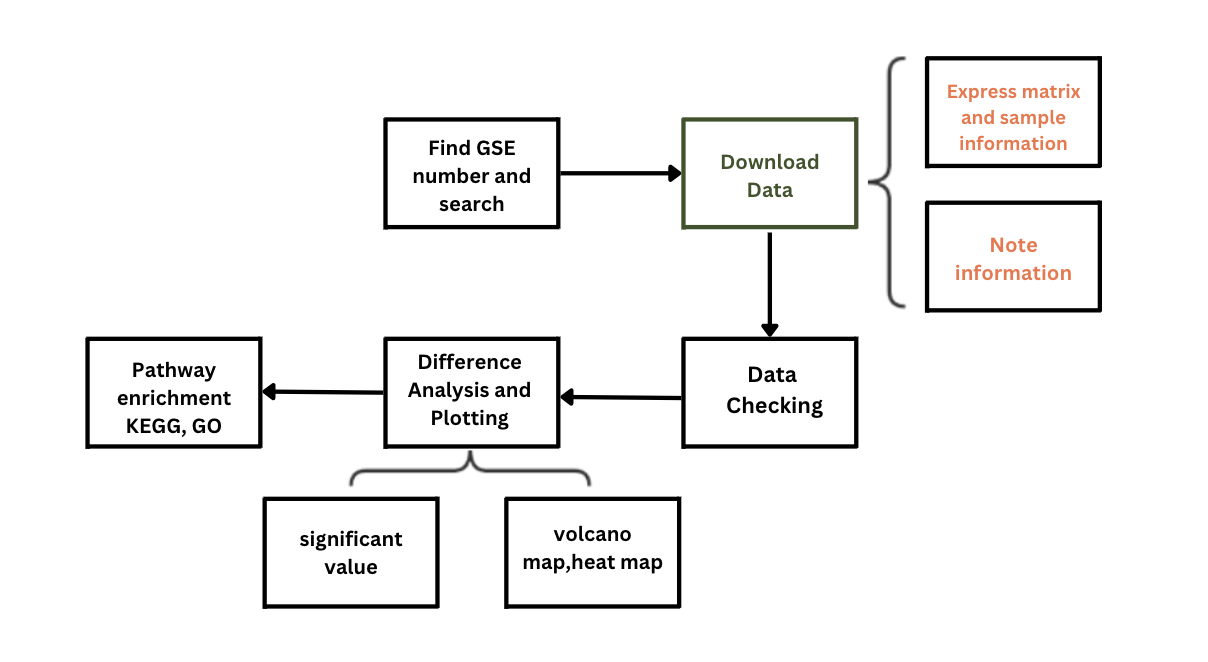
Analysis Process

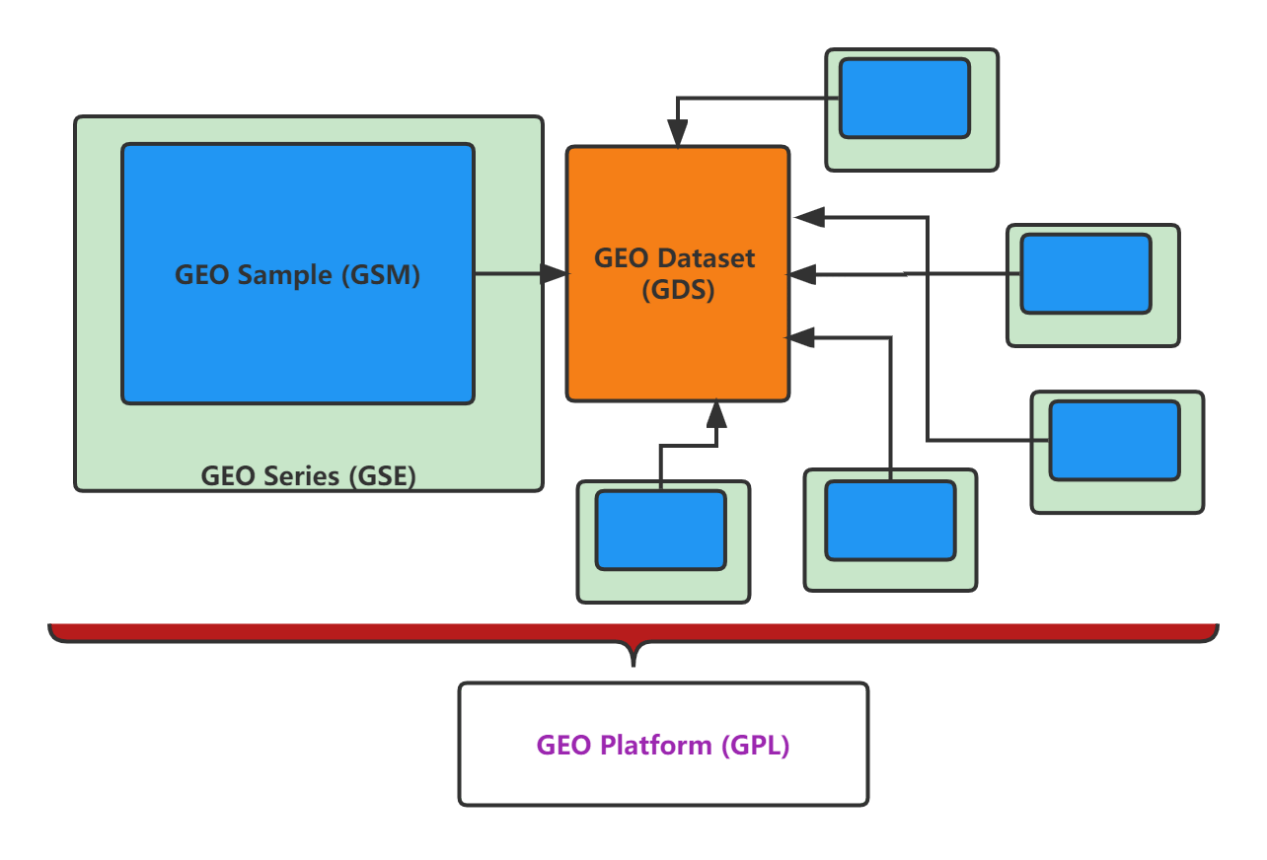
First, we need a GEO Series (GSE) number to search the GEO website for data of interest. The GSE number should be cited in the relevant research paper. A GEO Series record, which holds all experimental data submitted by an investigator, may include at least one Sample (GSM) record. A published study may have at least one GSE record. Depending on the research goals of a study, multiple GSM records may have been combined into a GEO Dataset (GDS) which are rarely used. Additionally, each Dataset has an associated platform that is GPL-licensed.
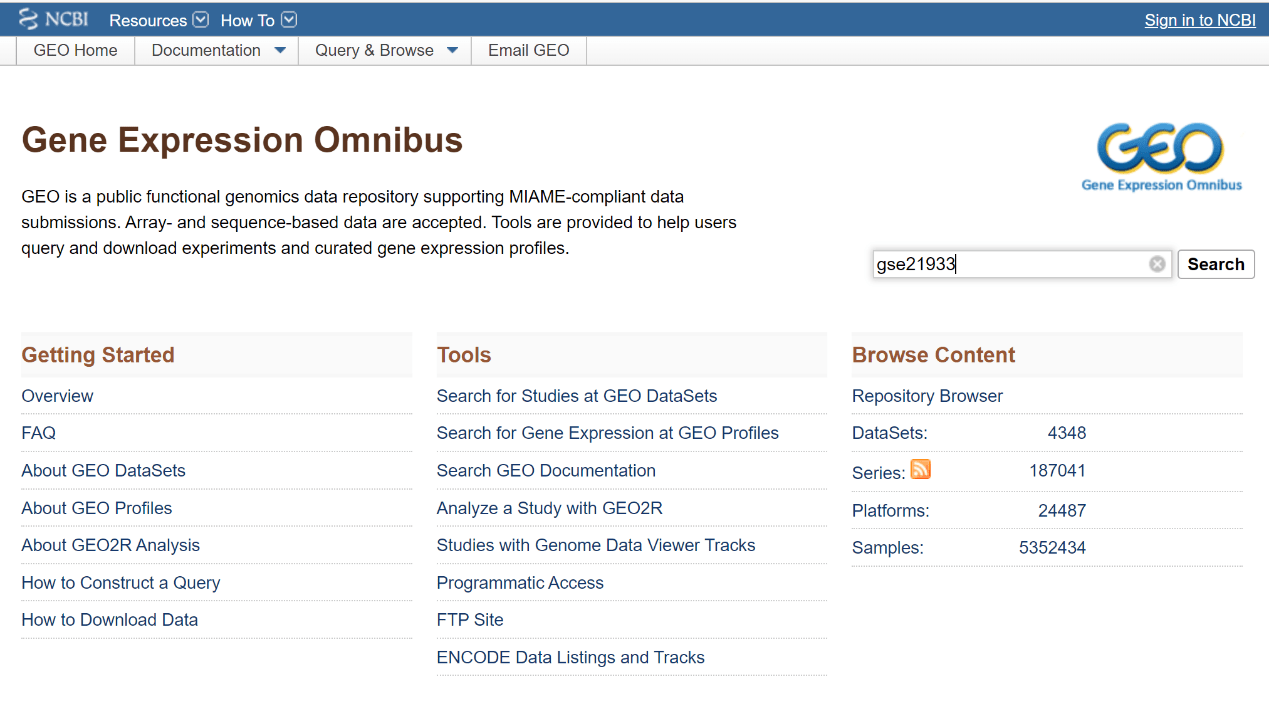
Downloading data from the GEO webpage To start, enter into the GEO official website at https://www.ncbi.nlm.nih.gov/geo, log in, and then type a GSE number in the search box (marked in red in the figure below). For example, enter “gse21933” and click “Search” first (1).
The following Accession Display interface includes fundamental GSE data details such as title, species, research summary, author, sample description, and sequencing platform, as well as the raw data.
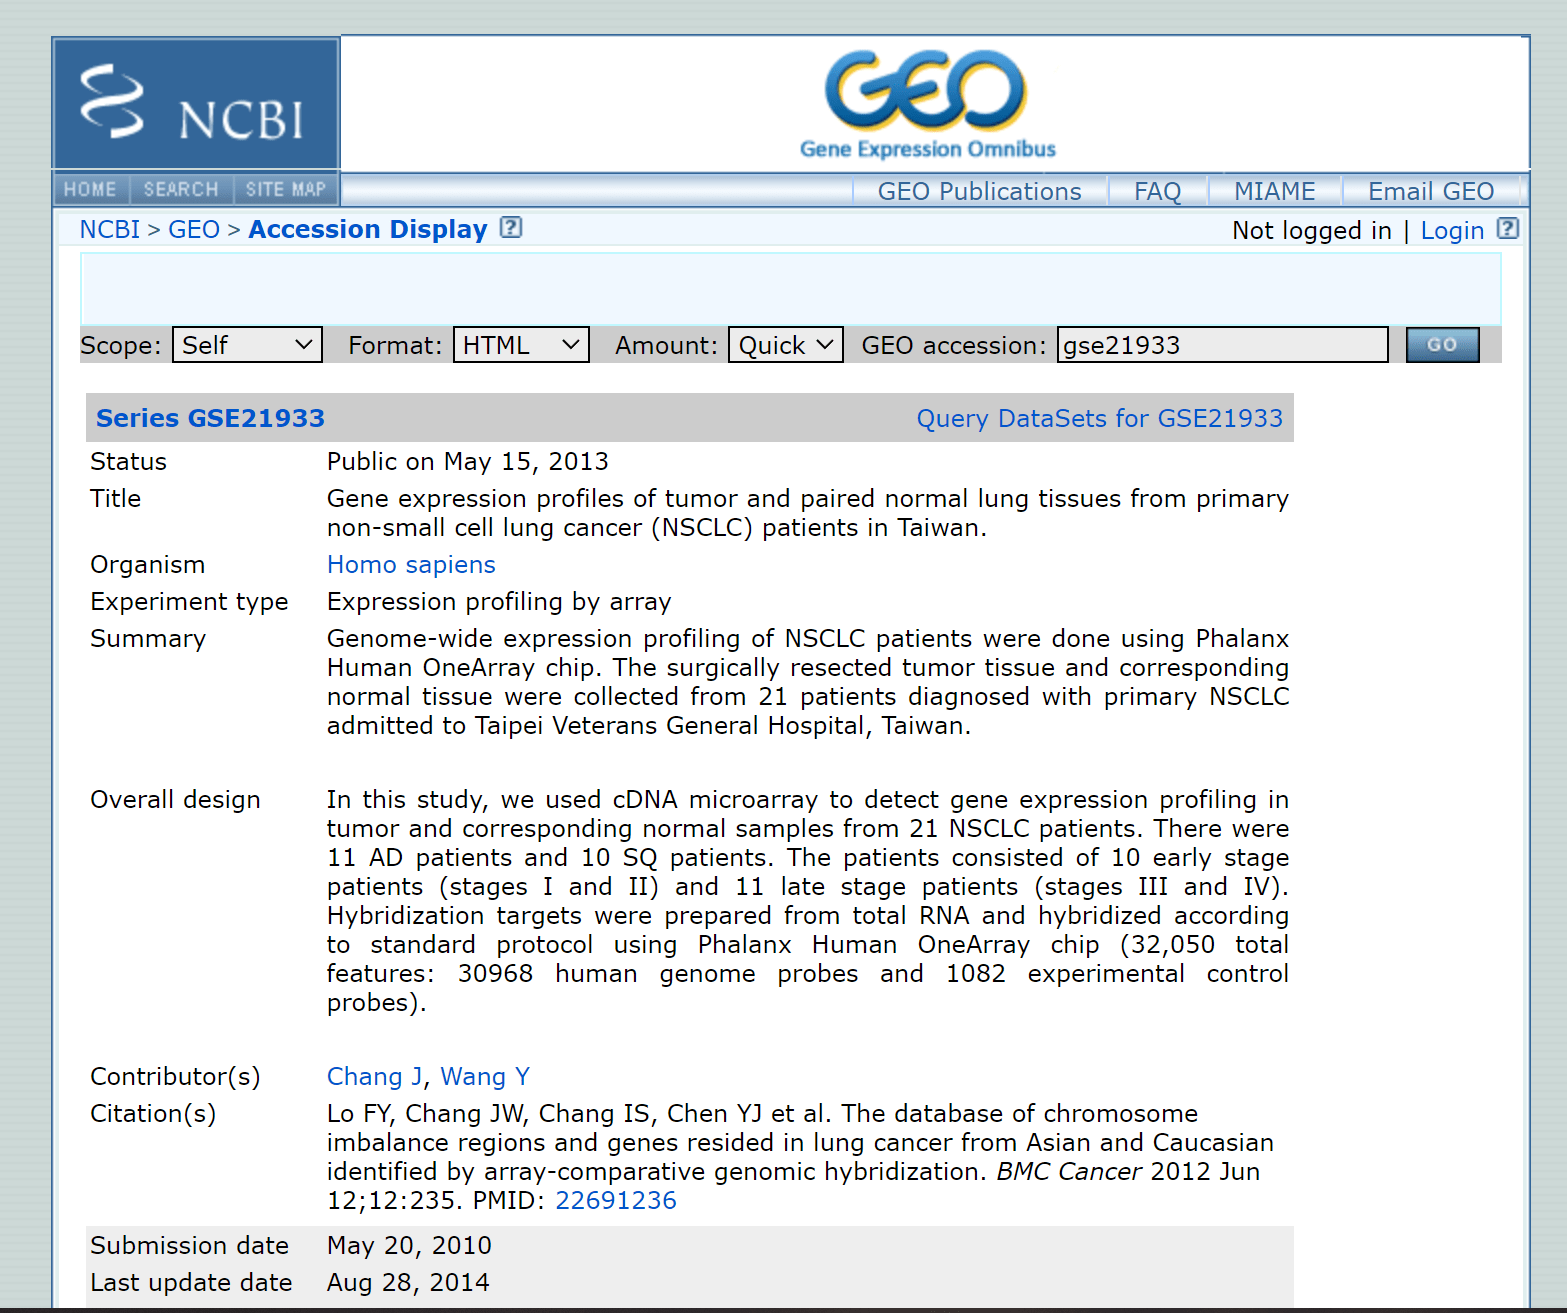
The example data set we have retrieved here (shown in the image above) includes gene expression profiles of lung cancer and healthy tissues. Identifying differentially expressed genes from this data requires three files: the original file, the phenotype file, and the annotation file.

1. The original file contains the expression level of genes in each sample.
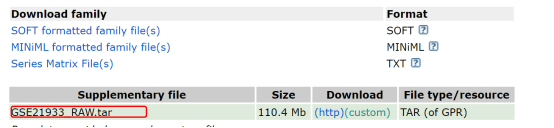
As shown in the figure above, the original file is available through a link at the bottom of the page. To download, click on “(http).” The file with tar format needs to be decompressed after downloading.

2. The phenotype file indicates whether each sample belongs to the normal group or to the treatment group. To compare the differences between normal and treatment samples, it is necessary to know the sample type used in each group.

The information about gene expression in samples is stored in the Series Matrix File (gene expression matrix).

3. The annotation files indicate which probe numbers correspond to which genes. Annotation files are necessary to identify the differential genes obtained from raw data processing.

As an analogy, these three categories of data can be thought of as cooking ingredients that are further used with different recipes. In this case the “recipes” are customized data mining analyses performed in accordance with your own demands and research objectives.

Downloading GEO data using an R package

Another option for downloading GEO data is GEOquery, a potent tool for downloading gene data. It is an R program currently hosted by the R open-source website BioConductor (2,3).

Use the following steps to download GEO data with GEOquery: Download

if (!require(“BiocManager”, quietly = TRUE)) install.packages(“BiocManager”) BiocManager::install(“GEOquery”)

Call

library(GEOquery)#directlycall eSet <- getGEO(“GSE21933”, destdir = ‘.’, getGPL = F)

The getGEO function can load the GSE matrix file. The annotation probe information will be downloaded by default, and the probes in the expression matrix will be annotated. However, the annotation file is quite extensive, thereby probably arising parsing preservation issues. To stop the annotation function by setting getGPL=F and manually annotating the data during the subsequent analysis steps are recommended.

Please continue to read the “GEO Data Mining” series of articles if you want to learn more about the ensuing tailored analysis. Downloading raw sequencing data from the Sequence Read Archive (SRA) database will be introduced in the next part.

References:

1.https://www.ncbi.nlm.nih.gov/geo/query/acc.cgi?acc=gse21933 (Accessed 12/11) 2.Davis S, Meltzer P (2007). “GEOquery: a bridge between the Gene Expression Omnibus (GEO) and BioConductor.” Bioinformatics, 14, 1846–1847. 3.https://bioconductor.org/packages/release/bioc/html/GEOquery.html (Accessed 12/11)

서비스서비스 menu

고객지원고객지원 menu

기업정보기업정보 menu

서비스
WGSDe novo SeqAmplicon SeqShotgun MetagenomeDM-SeqmRNA-SeqSingle Cell Gene ExpressionVisium HDXenium In SituOlinkUntargeted Metabolomics
고객지원
노보매직CSSFalcon 플랫폼
기업정보
회사소개글로벌 입지플랫폼뉴스룸채용 정보문의하기
LinkedInLinkedIn hoverYouTubeYouTube hoverXX hoverMetaMeta hoverInstagramInstagram hover
Copyright © 2026 Novogene Co., Ltd. All Rights Reserved. 노보진의 한국 내 모든 서비스는 연구 목적 (Research Use Only, RUO) 으로만 제공됩니다. 사업자등록번호: 494-86-03792 | 판매자번호: 노보진코리아유한회사 | 대표자명: 리휘시앙 | 사업자주소: 서울시 강서구 마곡동 779-1번지 뉴브클라우드힐스 BT-230, 231호, 07790 | 전화번호: 02-2038-8036
Novogene Korea
  • Novogene Korea
  • Genomics
    • Human Whole Genome Sequencing
    • Plant & Animal Whole Genome Sequencing
    • Microbial Whole Genome Sequencing
    • Whole Exome Sequencing
    • Plant & Animal De novo Sequencing
    • Microbial De novo Sequencing
    • Amplicon Sequencing
    • Shotgun Metagenomics Sequencing
    Transcriptomics
    • mRNA Sequencing
    • Total RNA Sequencing
    • Full-Length Transcriptome Sequencing
    • Whole Transcriptome Sequencing
    • Small RNA Sequencing
    • Circular RNA Sequencing
    • Metatranscriptome Sequencing
    • Prokaryotic RNA Sequencing
    Single Cell & Spatial Omics
    • Single Cell Gene Expression
    • Single Cell Immune Profiling Sequencing
    • Single Cell Long Read Transcriptome
    • Visium HD Spatial Gene Expression
    • Stereo-Seq Spatial Gene Expression
    • Xenium In Situ Spatial Transcriptome
    Epigenomics
    • Whole Genome Bisulfite Sequencing (WGBS)
    • Directed DNA Methylation Sequencing (DM-Seq) NEW
    • Reduced Representation Bisulfite Sequencing (RRBS)
    • Chromatin Immunoprecipitation Sequencing (ChIP-seq)
    • RNA Immunoprecipitation Sequencing (RIP-seq)
    • Assay for Transposase-Accessible Chromatin with Sequencing (ATAC-seq)

    Premade Library

    • Sequencing Only (Illumina 플랫폼)
    • Sequencing Only (PacBio 플랫폼)
    Proteomics & Metabolomics
    • Olink Proteomics
    • Quantitative Proteomics (MS)
    • Untargeted Metabolomics (MS)
  • 프로모션프로모션
    • 플랫폼
    • 자동화 운송 플랫폼 (Falcon)
    • BI 분석툴 (NovoMagic)
    • Customer Service System (CSS)
    • 브로셔
    • 케이스 스터디
    • 웨비나
    • 블로그
    • 샘플준비 가이드라인
    • 커뮤니티
    • 암 연구
    • 면역 종양학
    • 농업
    • 환경
    • 식품
    • 인간 마이크로바이옴
    • 동물 & 식물 마이크로바이옴
    • 신약개발
    • 희귀 질환 연구
    • 회사소개
    • 글로벌 입지
    • 뉴스룸
    • 채용 정보
  • 문의하기문의하기
  1. Home
  2. Resources
  3. Blog
  4. Gene Expression Omnibus Data Mining (IA): Quick and easy download of GEO data

Gene Expression Omnibus Data Mining (IA): Quick and easy download of GEO data

Data mining is a popular area of bioinformatics analysis. In general, “mining” refers to the acts of retrieving and gathering information from vast amounts of data in order to achieve particular study objectives. The Gene Expression Omnibus (GEO) database is a treasure trove of publicly available microarray and next-generation sequencing data, particularly transcription data. Data mining from GEO enables investigators to analyze differential expression, identify novel relationships or activities, extract significant conclusions, and build frameworks for new avenues of study.

This tutorial series describes the procedures and software tools needed to complete the main steps in the GEO data mining process:

  • Search datasets and download data
  • Generate expression matrix
  • Perform differential analysis
  • Identify and visualize differentially expressed genes
  • Proceed KEGG and GO enrichment analysis

We begin with the first step, downloading data from GEO. That data will be used subsequently to identify relevant genes and pathways. Initially, the goal is to locate the dataset used in a study of interest and download the corresponding GEO Platform (GPL) file with its expression matrix “series matrix” for gene expression analysis.

Analysis Process

First, we need a GEO Series (GSE) number to search the GEO website for data of interest. The GSE number should be cited in the relevant research paper. A GEO Series record, which holds all experimental data submitted by an investigator, may include at least one Sample (GSM) record. A published study may have at least one GSE record. Depending on the research goals of a study, multiple GSM records may have been combined into a GEO Dataset (GDS) which are rarely used. Additionally, each Dataset has an associated platform that is GPL-licensed.

Downloading data from the GEO webpage To start, enter into the GEO official website at https://www.ncbi.nlm.nih.gov/geo, log in, and then type a GSE number in the search box (marked in red in the figure below). For example, enter “gse21933” and click “Search” first (1).

The following Accession Display interface includes fundamental GSE data details such as title, species, research summary, author, sample description, and sequencing platform, as well as the raw data.

The example data set we have retrieved here (shown in the image above) includes gene expression profiles of lung cancer and healthy tissues. Identifying differentially expressed genes from this data requires three files: the original file, the phenotype file, and the annotation file.

1. The original file contains the expression level of genes in each sample.

As shown in the figure above, the original file is available through a link at the bottom of the page. To download, click on “(http).” The file with tar format needs to be decompressed after downloading.

2. The phenotype file indicates whether each sample belongs to the normal group or to the treatment group. To compare the differences between normal and treatment samples, it is necessary to know the sample type used in each group.

The information about gene expression in samples is stored in the Series Matrix File (gene expression matrix).

3. The annotation files indicate which probe numbers correspond to which genes. Annotation files are necessary to identify the differential genes obtained from raw data processing.

As an analogy, these three categories of data can be thought of as cooking ingredients that are further used with different recipes. In this case the “recipes” are customized data mining analyses performed in accordance with your own demands and research objectives.

Downloading GEO data using an R package

Another option for downloading GEO data is GEOquery, a potent tool for downloading gene data. It is an R program currently hosted by the R open-source website BioConductor (2,3).

Use the following steps to download GEO data with GEOquery: Download

if (!require(“BiocManager”, quietly = TRUE)) install.packages(“BiocManager”) BiocManager::install(“GEOquery”)

Call

library(GEOquery)#directlycall eSet <- getGEO(“GSE21933”, destdir = ‘.’, getGPL = F)

The getGEO function can load the GSE matrix file. The annotation probe information will be downloaded by default, and the probes in the expression matrix will be annotated. However, the annotation file is quite extensive, thereby probably arising parsing preservation issues. To stop the annotation function by setting getGPL=F and manually annotating the data during the subsequent analysis steps are recommended.

Please continue to read the “GEO Data Mining” series of articles if you want to learn more about the ensuing tailored analysis. Downloading raw sequencing data from the Sequence Read Archive (SRA) database will be introduced in the next part.

References:

1.https://www.ncbi.nlm.nih.gov/geo/query/acc.cgi?acc=gse21933 (Accessed 12/11) 2.Davis S, Meltzer P (2007). “GEOquery: a bridge between the Gene Expression Omnibus (GEO) and BioConductor.” Bioinformatics, 14, 1846–1847. 3.https://bioconductor.org/packages/release/bioc/html/GEOquery.html (Accessed 12/11)

서비스서비스 menu

고객지원고객지원 menu

기업정보기업정보 menu

서비스
WGSDe novo SeqAmplicon SeqShotgun MetagenomeDM-SeqmRNA-SeqSingle Cell Gene ExpressionVisium HDXenium In SituOlinkUntargeted Metabolomics
고객지원
노보매직CSSFalcon 플랫폼
기업정보
회사소개글로벌 입지플랫폼뉴스룸채용 정보문의하기
LinkedInLinkedIn hoverYouTubeYouTube hoverXX hoverMetaMeta hoverInstagramInstagram hover
Copyright © 2026 Novogene Co., Ltd. All Rights Reserved. 노보진의 한국 내 모든 서비스는 연구 목적 (Research Use Only, RUO) 으로만 제공됩니다. 사업자등록번호: 494-86-03792 | 판매자번호: 노보진코리아유한회사 | 대표자명: 리휘시앙 | 사업자주소: 서울시 강서구 마곡동 779-1번지 뉴브클라우드힐스 BT-230, 231호, 07790 | 전화번호: 02-2038-8036
Privacy PolicyCookie Policy