
Novogene Korea
  • Novogene Korea
  • Genomics
    • Human Whole Genome Sequencing
    • Plant & Animal Whole Genome Sequencing
    • Microbial Whole Genome Sequencing
    • Whole Exome Sequencing
    • Plant & Animal De novo Sequencing
    • Microbial De novo Sequencing
    • Amplicon Sequencing
    • Shotgun Metagenomics Sequencing
    Transcriptomics
    • mRNA Sequencing
    • Total RNA Sequencing
    • Full-Length Transcriptome Sequencing
    • Whole Transcriptome Sequencing
    • Small RNA Sequencing
    • Circular RNA Sequencing
    • Metatranscriptome Sequencing
    • Prokaryotic RNA Sequencing
    Single Cell & Spatial Omics
    • Single Cell Gene Expression
    • Single Cell Immune Profiling Sequencing
    • Single Cell Long Read Transcriptome
    • Visium HD Spatial Gene Expression
    • Stereo-Seq Spatial Gene Expression
    • Xenium In Situ Spatial Transcriptome
    Epigenomics
    • Whole Genome Bisulfite Sequencing (WGBS)
    • Directed DNA Methylation Sequencing (DM-Seq) NEW
    • Reduced Representation Bisulfite Sequencing (RRBS)
    • Chromatin Immunoprecipitation Sequencing (ChIP-seq)
    • RNA Immunoprecipitation Sequencing (RIP-seq)
    • Assay for Transposase-Accessible Chromatin with Sequencing (ATAC-seq)

    Premade Library

    • Sequencing Only (Illumina 플랫폼)
    • Sequencing Only (PacBio 플랫폼)
    Proteomics & Metabolomics
    • Olink Proteomics
    • Quantitative Proteomics (MS)
    • Untargeted Metabolomics (MS)
  • 프로모션프로모션
    • 플랫폼
    • 자동화 운송 플랫폼 (Falcon)
    • BI 분석툴 (NovoMagic)
    • Customer Service System (CSS)
    • 브로셔
    • 케이스 스터디
    • 웨비나
    • 블로그
    • 샘플준비 가이드라인
    • 커뮤니티
    • 암 연구
    • 면역 종양학
    • 농업
    • 환경
    • 식품
    • 인간 마이크로바이옴
    • 동물 & 식물 마이크로바이옴
    • 신약개발
    • 희귀 질환 연구
    • 회사소개
    • 글로벌 입지
    • 뉴스룸
    • 채용 정보
  • 문의하기문의하기
  1. Home
  2. Resources
  3. Blog
  4. Four Powered Online Tools for Genomic Analysis and Visualization (II) - jvenn

Four Powered Online Tools for Genomic Analysis and Visualization (II) - jvenn

II.jvenn – Venn diagram drawing

Commonly used to display comparison, Venn diagrams in biology enable users to show the differences between gene lists that originate from different analyses. Venn diagrams are useful tools allowing for the comparison between different experimental conditions and different methods in use. However, when the number of lists to be compared is more than four, the diagram can be cumbersome to read and analyze. To solve this exact shortcoming seen in the existing software packages, jvenn tool has been developed as a JQuery plugin.

jvenn can handle up to six different input lists, using either classical or Edwards-Venn layouts. The user inputs can be easily customized and controlled for output optimization, and one can easily embed the jvenn in a webpage, making it more dynamic. The jvenn library packages comes with full documentation in figure of .png/.svg or statistic data in .csv and examples, and it is available freely at http://bioinfo.genotoul.fr/jvenn. Another feature of jvenn that makes it more desirable is that it does not need any local installation. Statistics charts incorporated in jvenn allow for a simple and quick overview of the sizes of different lists as well their overlaps, giving it an edge over other comparable packages available so far.

Three different input formats are accepted by the jvenn library: “lists”, “Intersection counts” and “count lists”. The lists are composed of different elements which are given in the fields “data”. For “intersection counts”, the lists are labelled (‘A’ or ‘B’), used to correspond between the list and its count. “Count lists” give a count number for individual elements in the list. All of this is intuitively easy to read as for example, when the user points at an intersection count, all list(s) sharing the intersection are highlighted.
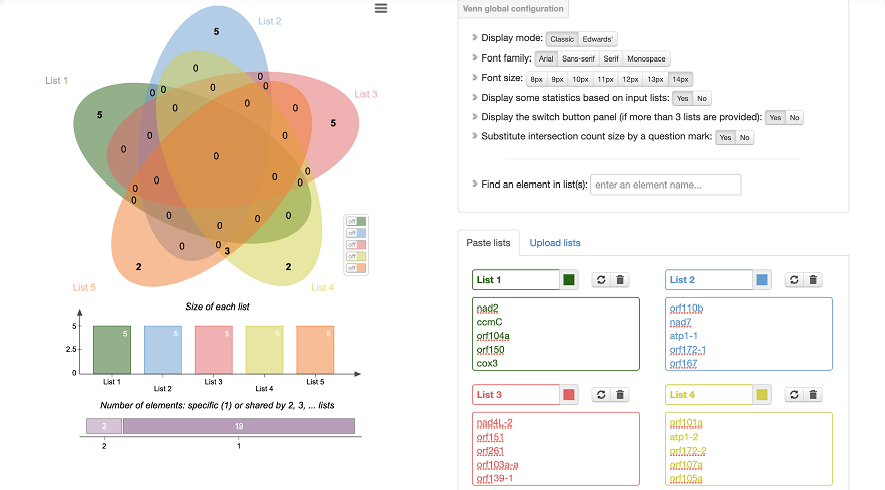
Figure 1. Example from online jvenn tool

Hence, jvenn provides a user-friendly interface with enhanced readability for different analytical visualizations, for example OTUs (operational taxonomic units). Jvenn makes it much easier for bioinformatic analysis to profile the counts of common and unique differential genes in multiple groups. It can be directly used as a web application at http://jvenn.toulouse.inra.fr/app/example.html [1].

To be continued…

Reference [1] Bardou, P., Mariette, J., Escudié, F. et al. jvenn: an interactive Venn diagram viewer. BMC Bioinformatics 15, 293 (2014). https://doi.org/10.1186/1471-2105-15-293

서비스서비스 menu

고객지원고객지원 menu

기업정보기업정보 menu

서비스
WGSDe novo SeqAmplicon SeqShotgun MetagenomeDM-SeqmRNA-SeqSingle Cell Gene ExpressionVisium HDXenium In SituOlinkUntargeted Metabolomics
고객지원
노보매직CSSFalcon 플랫폼
기업정보
회사소개글로벌 입지플랫폼뉴스룸채용 정보문의하기
LinkedInLinkedIn hoverYouTubeYouTube hoverXX hoverMetaMeta hoverInstagramInstagram hover
Copyright © 2026 Novogene Co., Ltd. All Rights Reserved. 노보진의 한국 내 모든 서비스는 연구 목적 (Research Use Only, RUO) 으로만 제공됩니다. 사업자등록번호: 494-86-03792 | 판매자번호: 노보진코리아유한회사 | 대표자명: 리휘시앙 | 사업자주소: 서울시 강서구 마곡동 779-1번지 뉴브클라우드힐스 BT-230, 231호, 07790 | 전화번호: 02-2038-8036
Novogene Korea
  • Novogene Korea
  • Genomics
    • Human Whole Genome Sequencing
    • Plant & Animal Whole Genome Sequencing
    • Microbial Whole Genome Sequencing
    • Whole Exome Sequencing
    • Plant & Animal De novo Sequencing
    • Microbial De novo Sequencing
    • Amplicon Sequencing
    • Shotgun Metagenomics Sequencing
    Transcriptomics
    • mRNA Sequencing
    • Total RNA Sequencing
    • Full-Length Transcriptome Sequencing
    • Whole Transcriptome Sequencing
    • Small RNA Sequencing
    • Circular RNA Sequencing
    • Metatranscriptome Sequencing
    • Prokaryotic RNA Sequencing
    Single Cell & Spatial Omics
    • Single Cell Gene Expression
    • Single Cell Immune Profiling Sequencing
    • Single Cell Long Read Transcriptome
    • Visium HD Spatial Gene Expression
    • Stereo-Seq Spatial Gene Expression
    • Xenium In Situ Spatial Transcriptome
    Epigenomics
    • Whole Genome Bisulfite Sequencing (WGBS)
    • Directed DNA Methylation Sequencing (DM-Seq) NEW
    • Reduced Representation Bisulfite Sequencing (RRBS)
    • Chromatin Immunoprecipitation Sequencing (ChIP-seq)
    • RNA Immunoprecipitation Sequencing (RIP-seq)
    • Assay for Transposase-Accessible Chromatin with Sequencing (ATAC-seq)

    Premade Library

    • Sequencing Only (Illumina 플랫폼)
    • Sequencing Only (PacBio 플랫폼)
    Proteomics & Metabolomics
    • Olink Proteomics
    • Quantitative Proteomics (MS)
    • Untargeted Metabolomics (MS)
  • 프로모션프로모션
    • 플랫폼
    • 자동화 운송 플랫폼 (Falcon)
    • BI 분석툴 (NovoMagic)
    • Customer Service System (CSS)
    • 브로셔
    • 케이스 스터디
    • 웨비나
    • 블로그
    • 샘플준비 가이드라인
    • 커뮤니티
    • 암 연구
    • 면역 종양학
    • 농업
    • 환경
    • 식품
    • 인간 마이크로바이옴
    • 동물 & 식물 마이크로바이옴
    • 신약개발
    • 희귀 질환 연구
    • 회사소개
    • 글로벌 입지
    • 뉴스룸
    • 채용 정보
  • 문의하기문의하기
  1. Home
  2. Resources
  3. Blog
  4. Four Powered Online Tools for Genomic Analysis and Visualization (II) - jvenn

Four Powered Online Tools for Genomic Analysis and Visualization (II) - jvenn

II.jvenn – Venn diagram drawing

Commonly used to display comparison, Venn diagrams in biology enable users to show the differences between gene lists that originate from different analyses. Venn diagrams are useful tools allowing for the comparison between different experimental conditions and different methods in use. However, when the number of lists to be compared is more than four, the diagram can be cumbersome to read and analyze. To solve this exact shortcoming seen in the existing software packages, jvenn tool has been developed as a JQuery plugin.

jvenn can handle up to six different input lists, using either classical or Edwards-Venn layouts. The user inputs can be easily customized and controlled for output optimization, and one can easily embed the jvenn in a webpage, making it more dynamic. The jvenn library packages comes with full documentation in figure of .png/.svg or statistic data in .csv and examples, and it is available freely at http://bioinfo.genotoul.fr/jvenn. Another feature of jvenn that makes it more desirable is that it does not need any local installation. Statistics charts incorporated in jvenn allow for a simple and quick overview of the sizes of different lists as well their overlaps, giving it an edge over other comparable packages available so far.

Three different input formats are accepted by the jvenn library: “lists”, “Intersection counts” and “count lists”. The lists are composed of different elements which are given in the fields “data”. For “intersection counts”, the lists are labelled (‘A’ or ‘B’), used to correspond between the list and its count. “Count lists” give a count number for individual elements in the list. All of this is intuitively easy to read as for example, when the user points at an intersection count, all list(s) sharing the intersection are highlighted.

Figure 1. Example from online jvenn tool

Hence, jvenn provides a user-friendly interface with enhanced readability for different analytical visualizations, for example OTUs (operational taxonomic units). Jvenn makes it much easier for bioinformatic analysis to profile the counts of common and unique differential genes in multiple groups. It can be directly used as a web application at http://jvenn.toulouse.inra.fr/app/example.html [1].

To be continued…

Reference [1] Bardou, P., Mariette, J., Escudié, F. et al. jvenn: an interactive Venn diagram viewer. BMC Bioinformatics 15, 293 (2014). https://doi.org/10.1186/1471-2105-15-293

서비스서비스 menu

고객지원고객지원 menu

기업정보기업정보 menu

서비스
WGSDe novo SeqAmplicon SeqShotgun MetagenomeDM-SeqmRNA-SeqSingle Cell Gene ExpressionVisium HDXenium In SituOlinkUntargeted Metabolomics
고객지원
노보매직CSSFalcon 플랫폼
기업정보
회사소개글로벌 입지플랫폼뉴스룸채용 정보문의하기
LinkedInLinkedIn hoverYouTubeYouTube hoverXX hoverMetaMeta hoverInstagramInstagram hover
Copyright © 2026 Novogene Co., Ltd. All Rights Reserved. 노보진의 한국 내 모든 서비스는 연구 목적 (Research Use Only, RUO) 으로만 제공됩니다. 사업자등록번호: 494-86-03792 | 판매자번호: 노보진코리아유한회사 | 대표자명: 리휘시앙 | 사업자주소: 서울시 강서구 마곡동 779-1번지 뉴브클라우드힐스 BT-230, 231호, 07790 | 전화번호: 02-2038-8036
Privacy PolicyCookie Policy