Novogene Korea
  • Novogene Korea
  • Genomics
    • Human Whole Genome Sequencing
    • Plant & Animal Whole Genome Sequencing
    • Microbial Whole Genome Sequencing
    • Whole Exome Sequencing
    • Plant & Animal De novo Sequencing
    • Microbial De novo Sequencing
    • Amplicon Sequencing
    • Shotgun Metagenomics Sequencing
    Transcriptomics
    • mRNA Sequencing
    • Total RNA Sequencing
    • Full-Length Transcriptome Sequencing
    • Whole Transcriptome Sequencing
    • Small RNA Sequencing
    • Circular RNA Sequencing
    • Metatranscriptome Sequencing
    • Prokaryotic RNA Sequencing
    Single Cell & Spatial Omics
    • Single Cell Gene Expression
    • Single Cell Immune Profiling Sequencing
    • Single Cell Long Read Transcriptome
    • Visium HD Spatial Gene Expression
    • Stereo-Seq Spatial Gene Expression
    • Xenium In Situ Spatial Transcriptome
    Epigenomics
    • Whole Genome Bisulfite Sequencing (WGBS)
    • Directed DNA Methylation Sequencing (DM-Seq) NEW
    • Reduced Representation Bisulfite Sequencing (RRBS)
    • Chromatin Immunoprecipitation Sequencing (ChIP-seq)
    • RNA Immunoprecipitation Sequencing (RIP-seq)
    • Assay for Transposase-Accessible Chromatin with Sequencing (ATAC-seq)

    Premade Library

    • Sequencing Only (Illumina 플랫폼)
    • Sequencing Only (PacBio 플랫폼)
    Proteomics & Metabolomics
    • Olink Proteomics
    • Quantitative Proteomics (MS)
    • Untargeted Metabolomics (MS)
  • 프로모션프로모션
    • 플랫폼
    • 자동화 운송 플랫폼 (Falcon)
    • BI 분석툴 (NovoMagic)
    • Customer Service System (CSS)
    • 브로셔
    • 케이스 스터디
    • 웨비나
    • 블로그
    • 샘플준비 가이드라인
    • 커뮤니티
    • 암 연구
    • 면역 종양학
    • 농업
    • 환경
    • 식품
    • 인간 마이크로바이옴
    • 동물 & 식물 마이크로바이옴
    • 신약개발
    • 희귀 질환 연구
    • 회사소개
    • 글로벌 입지
    • 뉴스룸
    • 채용 정보
  • 문의하기문의하기
  1. Home
  2. Resources
  3. Blog
  4. A Beginner’s Guide to 16S/18S/ITS Amplicon Metagenomic Sequencing

A Beginner’s Guide to 16S/18S/ITS Amplicon Metagenomic Sequencing

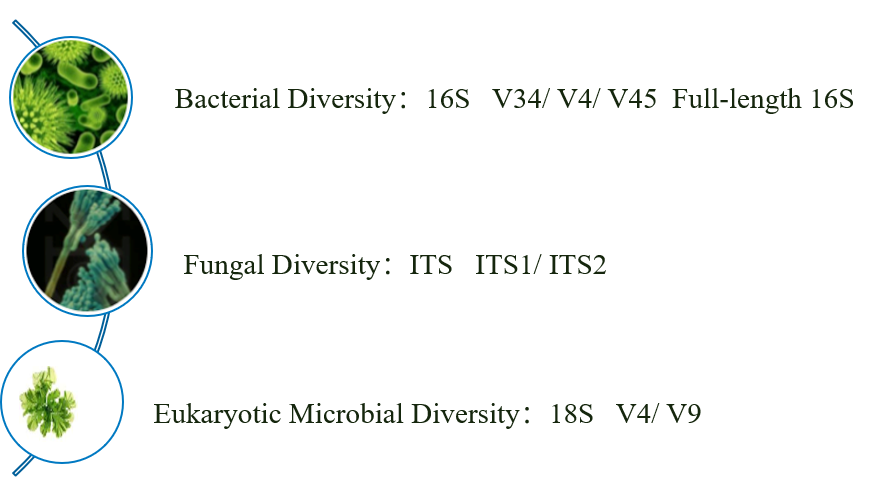
Introduction 16S/18S/ITS amplicon metagenomic sequencing is designated to sequence the target genes of 16S ribosomal RNA (rRNA), or 18S rRNA and Internal Transcribed Spacer (ITS) by universal primers. The services are applied to study the phylogeny and taxonomy of bacteria (and archaea) and fungi, gene variations in specific genomic regions, and the diversity of microorganisms.
Workflow of Amplicon Metagenomic Sequencing

Workflow of Amplicon Metagenomic Sequencing
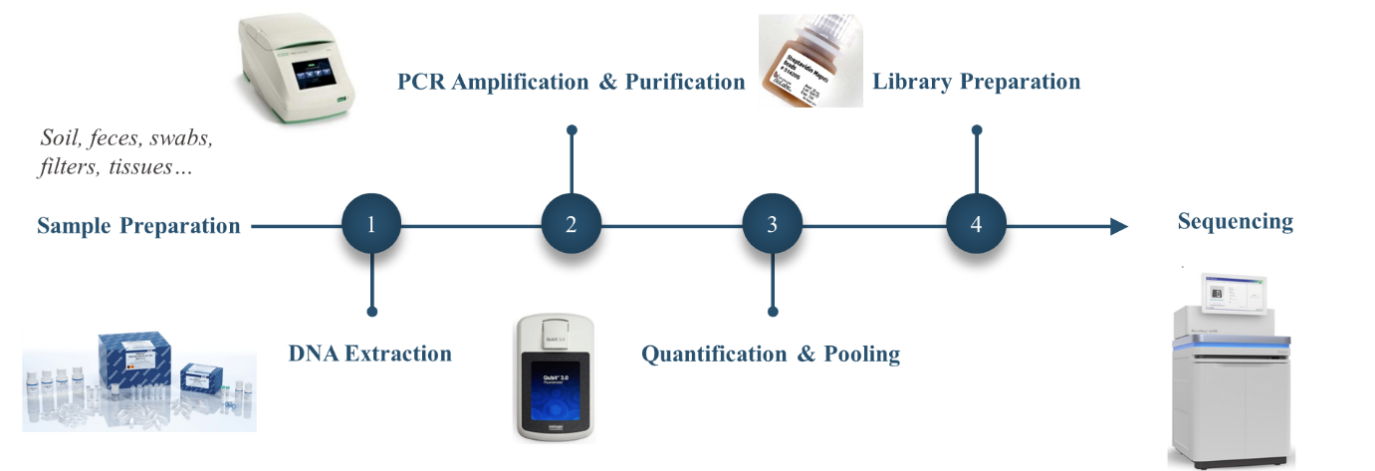
  • DNA Extraction: Novogene recommends the conventional CTAB (Cetyl trimethylammonium bromide) technique or other commercial kits in the DNA extraction stage, and offers tips and method recommendations for researchers who do their own extractions. The following format shows the sample requirements.

  • PCR Amplification & Purification: PCR amplification of targeted regions was performed by using specific primers connecting with barcodes. In addition to the in-house primers shown in 16S/18S/ITS Amplicon Metagenomic Sequencing, Novogene also accepts customized primer designs and offer primer synthesis services for clients. PCR products are purified with magnetic beads to remove residual enzyme and primer, then undergo QC before moving to the library preparation step.
  • Quantification and Pooling: For sample quality control of the 16SV4, 16SV34, ITS1-1F, and ITS1-5F regions, Novogene uses Agilent 5400 (AATI) instruments with higher sensitivity and resolution. If clients prefer not to use AATI, we could redo the quantification using conventional agarose gel electrophoresis.
  • Library Preparation and Sequencing: The same amount of PCR products from each sample was pooled, end-repaired, A-tailed, and further ligated with Illumina adapters. The library was checked with Qubit and real-time PCR for quantification, while a bioanalyzer was used for size distribution detection. Quantified libraries were pooled and sequenced on Illumina platforms according to the effective library concentration and data amount required.

Standard Bioinformatics Analysis of Amplicon Metagenomic Sequencing Two bioinformatics packages are available from Novogene, Qiime1 and Qiime2. The noticed difference is Qiime1 analysis only contains OTU analysis results, while Qiime2 analysis only contains ASV analysis results, and is able to resolve sequence differences by as little as a single nucleotide change, thus avoiding similarity-based analysis. The workflow of Qiime2 (Novogene’s default) is shown below.
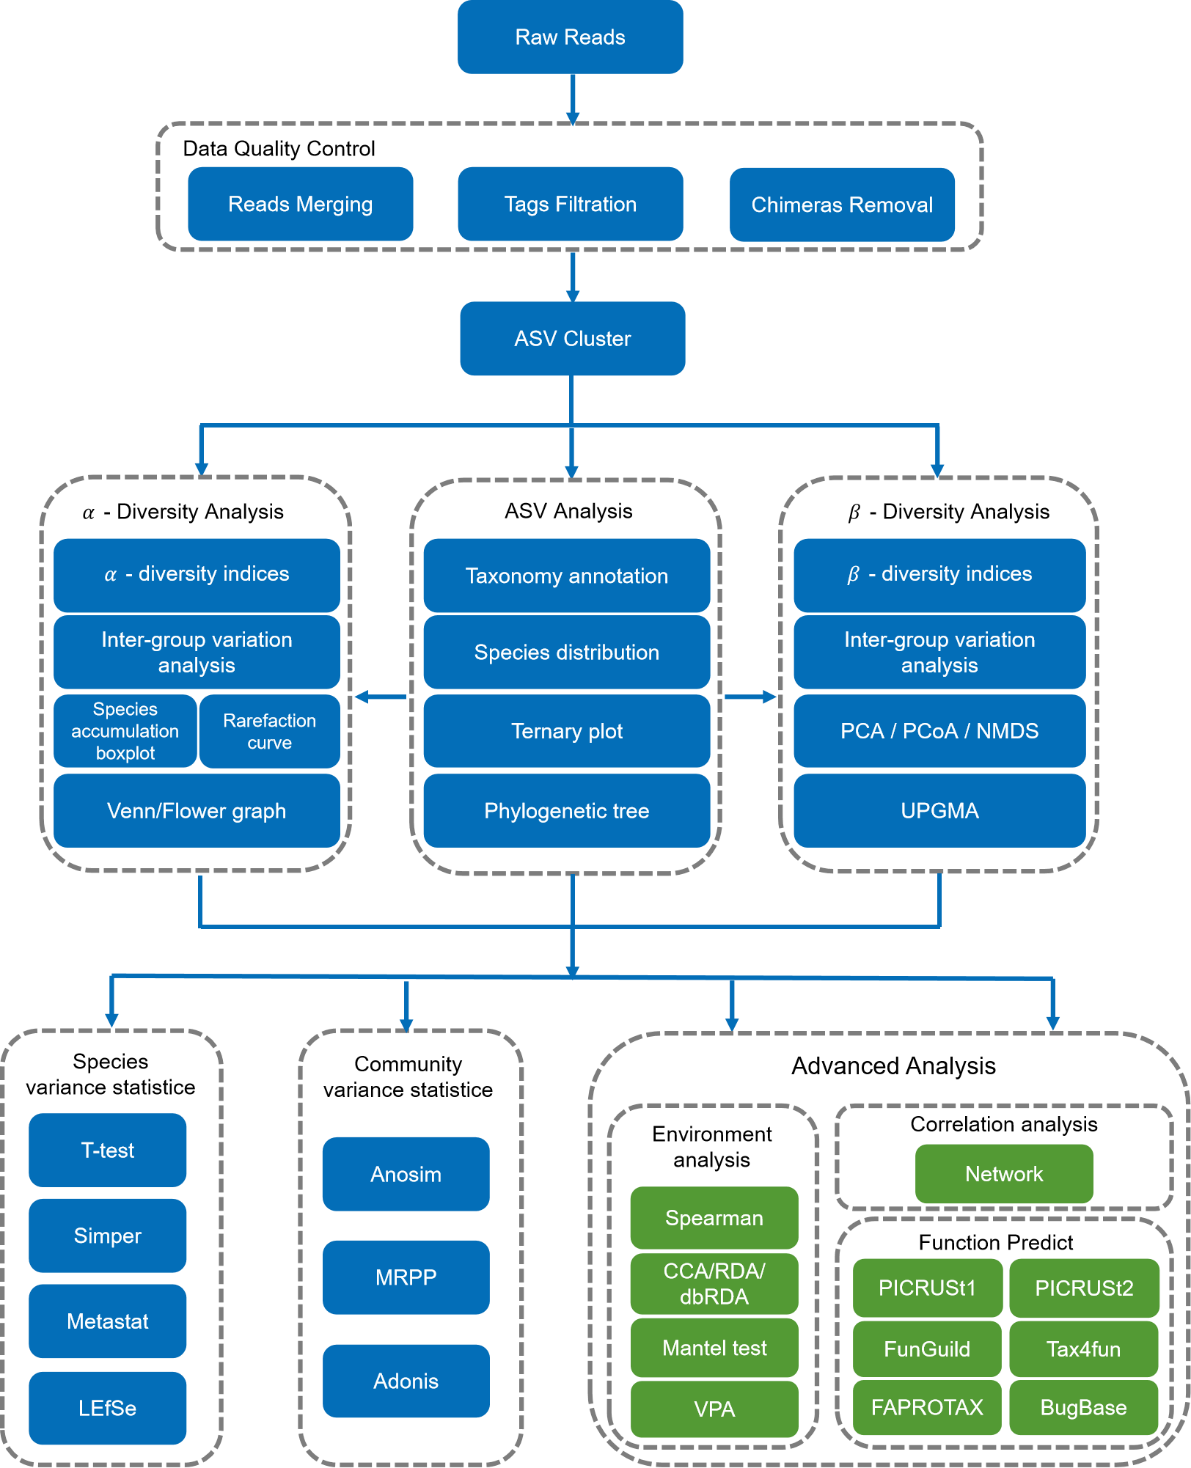
Qiime2 Analysis Workflow

After the data were merged and filtered, the effective tags were used for further OTU/ASV cluster analysis to perform taxa annotation. In the examples shown below, according to OTUs annotation results, taxa abundance could be obtained at the different level.

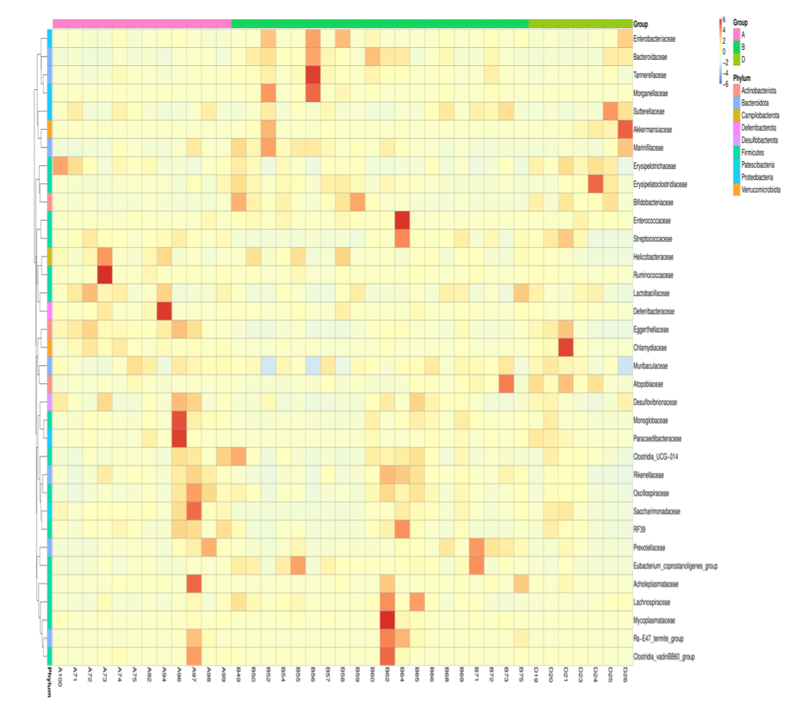
In the Relative Abundance Analysis, top 10 taxa of each sample or group at each taxonomic rank were selected to form the distribution histogram of the relative abundance of taxa. In the Taxonomic Abundance Cluster Heatmap, the darker the color the more a given phylum is clustered in its sample, so the similarity and differences of samples can be observed. According to the analysis result of OTU clustering and research requirements, each circle in the Venn diagram represents one sample or group after normalization of OUT table. Sames as the Flower diagram, values in overlapping parts represent common OTUs whereas the others are unique to each sample.

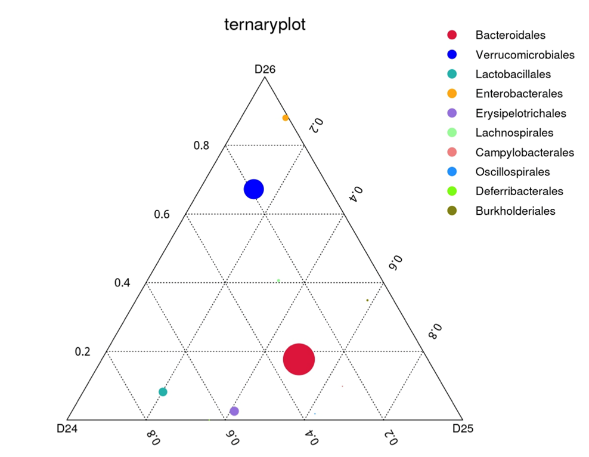
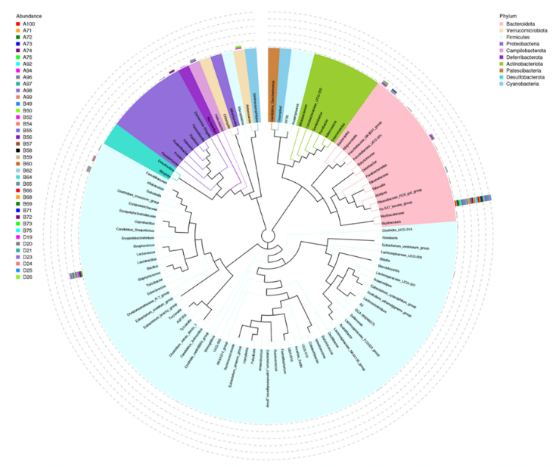
Ternary plot is used to find the differences in the dominant taxa among the three groups or samples at the selected taxonomic rank. To further study the phylogenetic relationship of the genera, the top 100 genera were selected, and the Evolutionary Tree was drawn using the aligned sequences, each group is displayed outside the circle and different colors represent different groups.
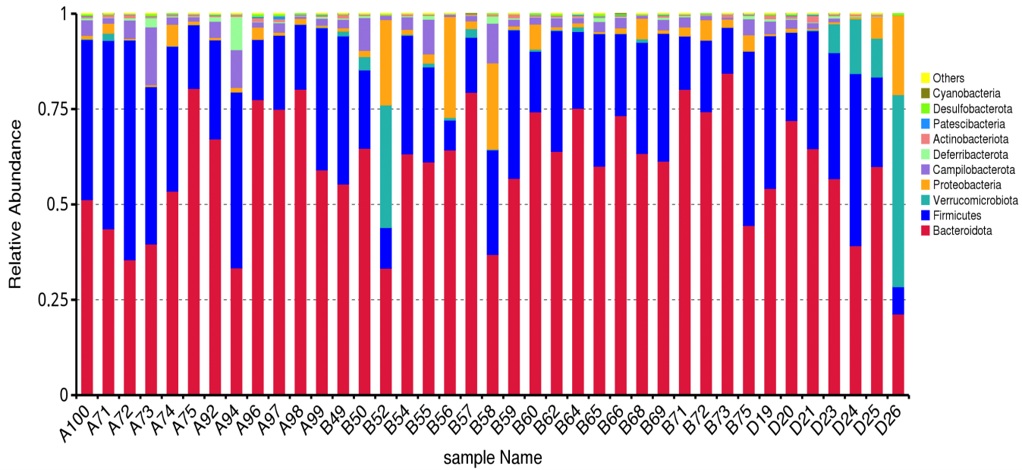
Relative Abundance
Taxonomic Abundance Cluster Heatmap
Venn and Flower Diagrams
Ternary Plot
Evolutionary Tree

Alpha diversity is applied to the analysis of microbial community diversity within the sample, reflecting the richness and diversity of microbial communities, which includes Species Accumulation Boxplot, Biodiversity Curves and a series of statistical analysis. Beta Diversity is a comparative analysis of microbial community composition of different samples, the differences were found through Beta Diversity Heatmap, Unweighted Pair-group Method with Arithmetic Mean (UPGMA), etc. In addition, Novogene also provides advanced analysis such as environment analysis, function prediction, etc. Application of Amplicon Metagenomic Sequencing

  1. Through 16S amplification metagenomics sequencing, Alpha Diversity and Beta Diversity of the Gut Microbiota was illustrated to determine microbial community composition between samples.
  2. Alteration in the microbiota were found through Taxonomic proportions at the phylum, family, and genus levels. Obtaining deep insight of specific taxa using statistical results, the relative abundances of significantly different biomarkers could be found.

In summary, Novogene is committed to provide their clients insights and solutions with advanced bioinformatics analysis capabilities, the extensive knowledge and experience, and the trusted services. Reference Yang, Li et al. “Comprehensive Analysis of the Relationships Between the Gut Microbiota and Fecal Metabolome in Individuals with Primary Sjogren’s Syndrome by 16S rRNA Sequencing and LC-MS-Based Metabolomics.” Frontiers in immunology vol. 13 874021. 11 May. 2022, doi:10.3389/fimmu.2022.874021 Bulgarelli, Davide et al. “Structure and function of the bacterial root microbiota in wild and domesticated barley.” Cell host & microbe vol. 17,3 (2015): 392-403. doi:10.1016/j.chom.2015.01.011 Langille, Morgan G I et al. “Predictive functional profiling of microbial communities using 16S rRNA marker gene sequences.” Nature biotechnology vol. 31,9 (2013): 814-21. doi:10.1038/nbt.2676

서비스서비스 menu

고객지원고객지원 menu

기업정보기업정보 menu

서비스
WGSDe novo SeqAmplicon SeqShotgun MetagenomeDM-SeqmRNA-SeqSingle Cell Gene ExpressionVisium HDXenium In SituOlinkUntargeted Metabolomics
고객지원
노보매직CSSFalcon 플랫폼
기업정보
회사소개글로벌 입지플랫폼뉴스룸채용 정보문의하기
LinkedInLinkedIn hoverYouTubeYouTube hoverXX hoverMetaMeta hoverInstagramInstagram hover
Copyright © 2026 Novogene Co., Ltd. All Rights Reserved. 노보진의 한국 내 모든 서비스는 연구 목적 (Research Use Only, RUO) 으로만 제공됩니다. 사업자등록번호: 494-86-03792 | 판매자번호: 노보진코리아유한회사 | 대표자명: 리휘시앙 | 사업자주소: 서울시 강서구 마곡동 779-1번지 뉴브클라우드힐스 BT-230, 231호, 07790 | 전화번호: 02-2038-8036
Novogene Korea
  • Novogene Korea
  • Genomics
    • Human Whole Genome Sequencing
    • Plant & Animal Whole Genome Sequencing
    • Microbial Whole Genome Sequencing
    • Whole Exome Sequencing
    • Plant & Animal De novo Sequencing
    • Microbial De novo Sequencing
    • Amplicon Sequencing
    • Shotgun Metagenomics Sequencing
    Transcriptomics
    • mRNA Sequencing
    • Total RNA Sequencing
    • Full-Length Transcriptome Sequencing
    • Whole Transcriptome Sequencing
    • Small RNA Sequencing
    • Circular RNA Sequencing
    • Metatranscriptome Sequencing
    • Prokaryotic RNA Sequencing
    Single Cell & Spatial Omics
    • Single Cell Gene Expression
    • Single Cell Immune Profiling Sequencing
    • Single Cell Long Read Transcriptome
    • Visium HD Spatial Gene Expression
    • Stereo-Seq Spatial Gene Expression
    • Xenium In Situ Spatial Transcriptome
    Epigenomics
    • Whole Genome Bisulfite Sequencing (WGBS)
    • Directed DNA Methylation Sequencing (DM-Seq) NEW
    • Reduced Representation Bisulfite Sequencing (RRBS)
    • Chromatin Immunoprecipitation Sequencing (ChIP-seq)
    • RNA Immunoprecipitation Sequencing (RIP-seq)
    • Assay for Transposase-Accessible Chromatin with Sequencing (ATAC-seq)

    Premade Library

    • Sequencing Only (Illumina 플랫폼)
    • Sequencing Only (PacBio 플랫폼)
    Proteomics & Metabolomics
    • Olink Proteomics
    • Quantitative Proteomics (MS)
    • Untargeted Metabolomics (MS)
  • 프로모션프로모션
    • 플랫폼
    • 자동화 운송 플랫폼 (Falcon)
    • BI 분석툴 (NovoMagic)
    • Customer Service System (CSS)
    • 브로셔
    • 케이스 스터디
    • 웨비나
    • 블로그
    • 샘플준비 가이드라인
    • 커뮤니티
    • 암 연구
    • 면역 종양학
    • 농업
    • 환경
    • 식품
    • 인간 마이크로바이옴
    • 동물 & 식물 마이크로바이옴
    • 신약개발
    • 희귀 질환 연구
    • 회사소개
    • 글로벌 입지
    • 뉴스룸
    • 채용 정보
  • 문의하기문의하기
  1. Home
  2. Resources
  3. Blog
  4. A Beginner’s Guide to 16S/18S/ITS Amplicon Metagenomic Sequencing

A Beginner’s Guide to 16S/18S/ITS Amplicon Metagenomic Sequencing

Introduction 16S/18S/ITS amplicon metagenomic sequencing is designated to sequence the target genes of 16S ribosomal RNA (rRNA), or 18S rRNA and Internal Transcribed Spacer (ITS) by universal primers. The services are applied to study the phylogeny and taxonomy of bacteria (and archaea) and fungi, gene variations in specific genomic regions, and the diversity of microorganisms.

Workflow of Amplicon Metagenomic Sequencing

Workflow of Amplicon Metagenomic Sequencing

  • DNA Extraction: Novogene recommends the conventional CTAB (Cetyl trimethylammonium bromide) technique or other commercial kits in the DNA extraction stage, and offers tips and method recommendations for researchers who do their own extractions. The following format shows the sample requirements.
  • PCR Amplification & Purification: PCR amplification of targeted regions was performed by using specific primers connecting with barcodes. In addition to the in-house primers shown in 16S/18S/ITS Amplicon Metagenomic Sequencing, Novogene also accepts customized primer designs and offer primer synthesis services for clients. PCR products are purified with magnetic beads to remove residual enzyme and primer, then undergo QC before moving to the library preparation step.
  • Quantification and Pooling: For sample quality control of the 16SV4, 16SV34, ITS1-1F, and ITS1-5F regions, Novogene uses Agilent 5400 (AATI) instruments with higher sensitivity and resolution. If clients prefer not to use AATI, we could redo the quantification using conventional agarose gel electrophoresis.
  • Library Preparation and Sequencing: The same amount of PCR products from each sample was pooled, end-repaired, A-tailed, and further ligated with Illumina adapters. The library was checked with Qubit and real-time PCR for quantification, while a bioanalyzer was used for size distribution detection. Quantified libraries were pooled and sequenced on Illumina platforms according to the effective library concentration and data amount required.

Standard Bioinformatics Analysis of Amplicon Metagenomic Sequencing Two bioinformatics packages are available from Novogene, Qiime1 and Qiime2. The noticed difference is Qiime1 analysis only contains OTU analysis results, while Qiime2 analysis only contains ASV analysis results, and is able to resolve sequence differences by as little as a single nucleotide change, thus avoiding similarity-based analysis. The workflow of Qiime2 (Novogene’s default) is shown below.

Qiime2 Analysis Workflow

After the data were merged and filtered, the effective tags were used for further OTU/ASV cluster analysis to perform taxa annotation. In the examples shown below, according to OTUs annotation results, taxa abundance could be obtained at the different level.

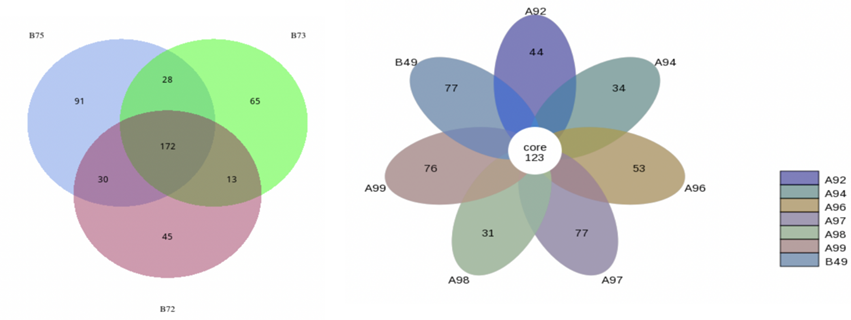
In the Relative Abundance Analysis, top 10 taxa of each sample or group at each taxonomic rank were selected to form the distribution histogram of the relative abundance of taxa. In the Taxonomic Abundance Cluster Heatmap, the darker the color the more a given phylum is clustered in its sample, so the similarity and differences of samples can be observed. According to the analysis result of OTU clustering and research requirements, each circle in the Venn diagram represents one sample or group after normalization of OUT table. Sames as the Flower diagram, values in overlapping parts represent common OTUs whereas the others are unique to each sample.

Ternary plot is used to find the differences in the dominant taxa among the three groups or samples at the selected taxonomic rank. To further study the phylogenetic relationship of the genera, the top 100 genera were selected, and the Evolutionary Tree was drawn using the aligned sequences, each group is displayed outside the circle and different colors represent different groups.
Relative Abundance
Taxonomic Abundance Cluster Heatmap
Venn and Flower Diagrams
Ternary Plot
Evolutionary Tree

Alpha diversity is applied to the analysis of microbial community diversity within the sample, reflecting the richness and diversity of microbial communities, which includes Species Accumulation Boxplot, Biodiversity Curves and a series of statistical analysis. Beta Diversity is a comparative analysis of microbial community composition of different samples, the differences were found through Beta Diversity Heatmap, Unweighted Pair-group Method with Arithmetic Mean (UPGMA), etc. In addition, Novogene also provides advanced analysis such as environment analysis, function prediction, etc. Application of Amplicon Metagenomic Sequencing

  1. Through 16S amplification metagenomics sequencing, Alpha Diversity and Beta Diversity of the Gut Microbiota was illustrated to determine microbial community composition between samples.
  2. Alteration in the microbiota were found through Taxonomic proportions at the phylum, family, and genus levels. Obtaining deep insight of specific taxa using statistical results, the relative abundances of significantly different biomarkers could be found.

In summary, Novogene is committed to provide their clients insights and solutions with advanced bioinformatics analysis capabilities, the extensive knowledge and experience, and the trusted services. Reference Yang, Li et al. “Comprehensive Analysis of the Relationships Between the Gut Microbiota and Fecal Metabolome in Individuals with Primary Sjogren’s Syndrome by 16S rRNA Sequencing and LC-MS-Based Metabolomics.” Frontiers in immunology vol. 13 874021. 11 May. 2022, doi:10.3389/fimmu.2022.874021 Bulgarelli, Davide et al. “Structure and function of the bacterial root microbiota in wild and domesticated barley.” Cell host & microbe vol. 17,3 (2015): 392-403. doi:10.1016/j.chom.2015.01.011 Langille, Morgan G I et al. “Predictive functional profiling of microbial communities using 16S rRNA marker gene sequences.” Nature biotechnology vol. 31,9 (2013): 814-21. doi:10.1038/nbt.2676

서비스서비스 menu

고객지원고객지원 menu

기업정보기업정보 menu

서비스
WGSDe novo SeqAmplicon SeqShotgun MetagenomeDM-SeqmRNA-SeqSingle Cell Gene ExpressionVisium HDXenium In SituOlinkUntargeted Metabolomics
고객지원
노보매직CSSFalcon 플랫폼
기업정보
회사소개글로벌 입지플랫폼뉴스룸채용 정보문의하기
LinkedInLinkedIn hoverYouTubeYouTube hoverXX hoverMetaMeta hoverInstagramInstagram hover
Copyright © 2026 Novogene Co., Ltd. All Rights Reserved. 노보진의 한국 내 모든 서비스는 연구 목적 (Research Use Only, RUO) 으로만 제공됩니다. 사업자등록번호: 494-86-03792 | 판매자번호: 노보진코리아유한회사 | 대표자명: 리휘시앙 | 사업자주소: 서울시 강서구 마곡동 779-1번지 뉴브클라우드힐스 BT-230, 231호, 07790 | 전화번호: 02-2038-8036
Privacy PolicyCookie Policy