Novogene Korea
  • Novogene Korea
  • Genomics
    • Human Whole Genome Sequencing
    • Plant & Animal Whole Genome Sequencing
    • Microbial Whole Genome Sequencing
    • Whole Exome Sequencing
    • Plant & Animal De novo Sequencing
    • Microbial De novo Sequencing
    • Amplicon Sequencing
    • Shotgun Metagenomics Sequencing
    Transcriptomics
    • mRNA Sequencing
    • Total RNA Sequencing
    • Full-Length Transcriptome Sequencing
    • Whole Transcriptome Sequencing
    • Small RNA Sequencing
    • Circular RNA Sequencing
    • Metatranscriptome Sequencing
    • Prokaryotic RNA Sequencing
    Single Cell & Spatial Omics
    • Single Cell Gene Expression
    • Single Cell Immune Profiling Sequencing
    • Single Cell Long Read Transcriptome
    • Visium HD Spatial Gene Expression
    • Stereo-Seq Spatial Gene Expression
    • Xenium In Situ Spatial Transcriptome
    Epigenomics
    • Whole Genome Bisulfite Sequencing (WGBS)
    • Directed DNA Methylation Sequencing (DM-Seq) NEW
    • Reduced Representation Bisulfite Sequencing (RRBS)
    • Chromatin Immunoprecipitation Sequencing (ChIP-seq)
    • RNA Immunoprecipitation Sequencing (RIP-seq)
    • Assay for Transposase-Accessible Chromatin with Sequencing (ATAC-seq)

    Premade Library

    • Sequencing Only (Illumina 플랫폼)
    • Sequencing Only (PacBio 플랫폼)
    Proteomics & Metabolomics
    • Olink Proteomics
    • Quantitative Proteomics (MS)
    • Untargeted Metabolomics (MS)
  • 프로모션프로모션
    • 플랫폼
    • 자동화 운송 플랫폼 (Falcon)
    • BI 분석툴 (NovoMagic)
    • Customer Service System (CSS)
    • 브로셔
    • 케이스 스터디
    • 웨비나
    • 블로그
    • 샘플준비 가이드라인
    • 커뮤니티
    • 암 연구
    • 면역 종양학
    • 농업
    • 환경
    • 식품
    • 인간 마이크로바이옴
    • 동물 & 식물 마이크로바이옴
    • 신약개발
    • 희귀 질환 연구
    • 회사소개
    • 글로벌 입지
    • 뉴스룸
    • 채용 정보
  • 문의하기문의하기
  1. Home
  2. Company
  3. Shared SNP percentage >96% in exome library data and quantification correlation >97% in transcriptome library data - NovaSeq X Plus new data release

Shared SNP percentage >96% in exome library data and quantification correlation >97% in transcriptome library data - NovaSeq X Plus new data release

The NovaSeq X Plus platform provides extraordinary sequencing power not only for whole genome sequencing but also for whole exome sequencing and transcriptome sequencing. Following the previous release of human whole genome sequencing test on the NovaSeq X Plus, data from more library types are now available.

1. Testing Result of Human Whole Exome Sequencing Library

To further evaluate the platform’s performance, a whole exome sequencing library with NA12878 was simultaneously sequenced on both the NovaSeq X Plus and NovaSeq 6000 platforms. The library was prepared using Agilent SureSelect Human All Exon V6.

1.1 Quality Control

Compared with the NovaSeq 6000, the NovaSeq X Plus platform performs better in Q30, with an average of 95.70%.

Table 1 Quality control of whole exome sequencing library
SamplePlatformEffective (%)Error (%)Q20 (%)Q30 (%)GC (%)Containing N (%)Low quality (%)Adapter related (%)
S_WNovaSeq 600097.880.0298.3195.1951.970.000.002.11
S_FC1_WL1XNovaSeq X Plus97.190.0397.5995.7351.260.010.002.8
S_FC1_WL2XNovaSeq X Plus97.000.0297.8796.1351.260.010.002.99
S_FC2_WL1XNovaSeq X Plus97.830.0397.2395.5650.580.000.002.17
S_FC2_WL2XNovaSeq X Plus97.730.0397.2195.3750.660.000.002.27
1.2 Mapping Statistics

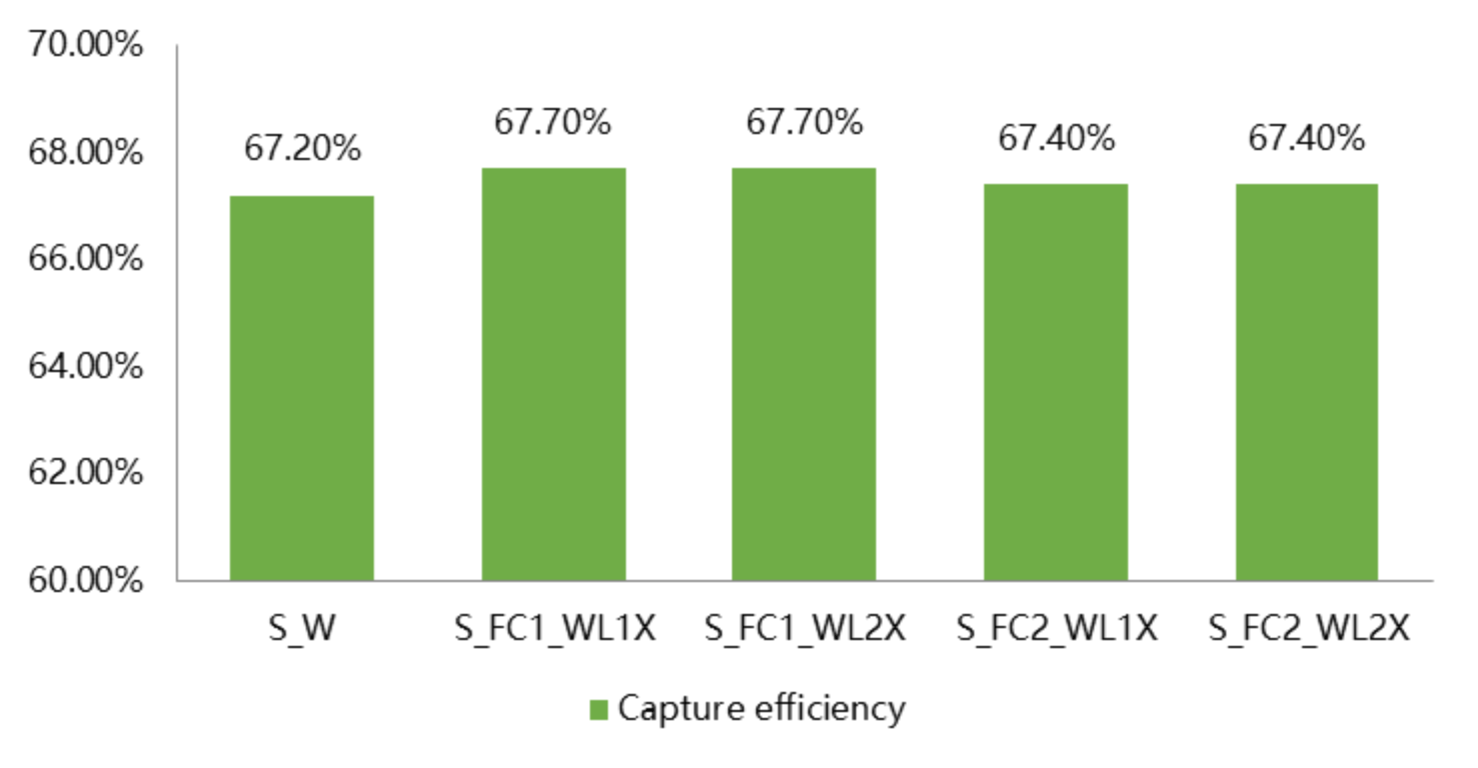
The NovaSeq X Plus achieves even coverage across the entire exome, with coverage of 99.5% and capture efficiency of 67.6%.

Table 2 Mapping statistics of whole exome sequencing library
SamplePlatformMapped (%)Properly (%)PE (%)Coverage (%)4X (%)10X (%)20X (%)
S_WNovaSeq 600099.9498.9899.9099.5099.1098.0095.10
S_FC1_WL1XNovaSeq X Plus99.9299.1699.8999.5099.0097.7094.70
S_FC1_WL2XNovaSeq X Plus99.9199.1699.8899.5099.0097.7094.60
S_FC2_WL1XNovaSeq X Plus99.9299.1599.8999.5099.0097.7094.70
S_FC2_WL2XNovaSeq X Plus99.9199.1399.8799.5099.0097.7094.70
Figure 1 Capture efficiency in NovaSeq X Plus and NovaSeq 6000
1.3 Variant Calling Accuracy

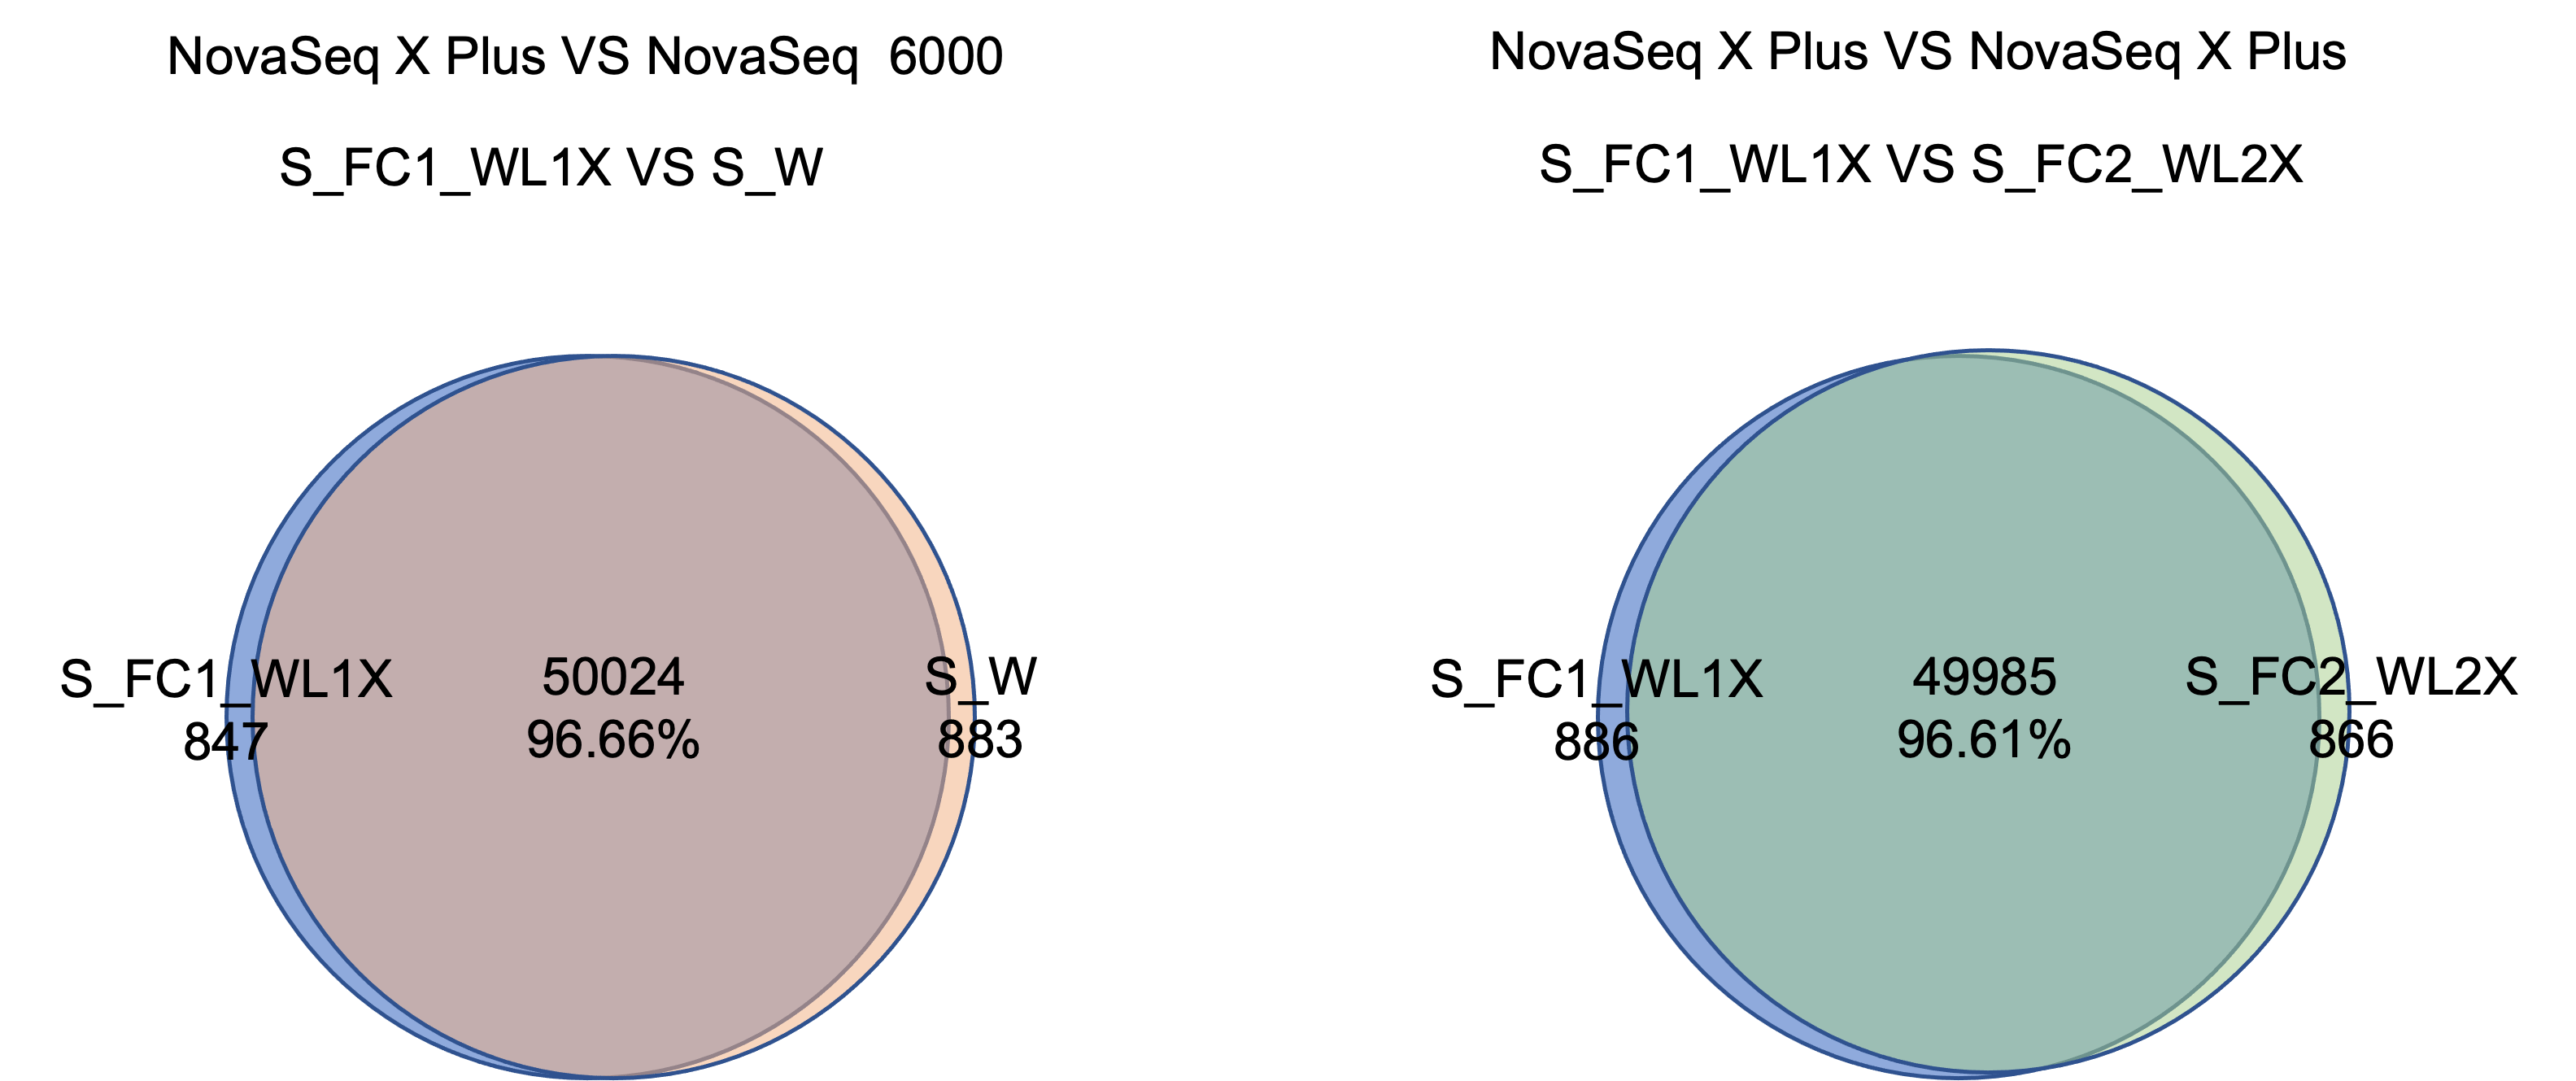
The NovaSeq X Plus and NovaSeq 6000 platforms have >96% similarity in SNP detection. The SNP and InDel precision and recall deviation between the two platforms is <0.5%.

Table 3 Variant calling result of whole exome sequencing library
SamplePlatformdbSNP (SNP) (%)dbSNP (InDel)(%)Precision (SNP) (%)Recall (SNP) (%)F-score (SNP) (%)Precision (InDel) (%)Recall (InDel) (%)F-score (InDel) (%)
S_WNovaSeq 600094.0286.3699.0596.8197.9289.4389.2889.35
S_FC1_WL1XNovaSeq X Plus94.3486.9598.9296.6797.7988.8189.6289.21
S_FC1_WL2XNovaSeq X Plus93.9486.3998.8796.7197.7888.7890.3989.58
S_FC2_WL1XNovaSeq X Plus94.7287.7098.9096.4897.6788.8689.1989.03
S_FC2_WL2XNovaSeq X Plus94.6987.3498.8196.5697.6788.5889.3988.98
Figure 2 Venn diagrams of shared SNPs between NovaSeq X Plus and NovaSeq 6000

2. Testing Result of mRNA Sequencing library

An mRNA sequencing library with UHRR was simultaneously sequenced on both the NovaSeq X Plus and NovaSeq 6000 to further evaluate the platform performance.

2.1 Quality Control and Mapping Statistics

The effective rate, Q30 score, and rRNA rate of NovaSeq X Plus are almost similar to that of NovaSeq 6000, with <1% deviation.

Table 4 Quality control of mRNA sequencing library
SamplePlatformEffective (%)Error rate (%)Q20 (%)Q30 (%)GC (%)rRNA (%)
UHRRNovaSeq 600095.850.0298.2895.0550.152.24
UHRR_L1NovaSeq X Plus94.210.0397.3395.2849.191.48
UHRR_L2NovaSeq X Plus93.850.0297.7095.7949.151.24
UHRR_L3NovaSeq X Plus95.540.0397.0795.2548.471.58
UHRR_L4NovaSeq X Plus95.440.0397.0295.0248.551.23
Table 5 Mapping statistics of mRNA sequencing library
SamplePlatformMapped (%)Unique map (%)Multi map (%)Exon (%)
UHRRNovaSeq 600095.7192.852.8690.16
UHRR_L1NovaSeq X Plus94.9092.342.5690.16
UHRR_L2NovaSeq X Plus95.0592.392.6690.13
UHRR_L3NovaSeq X Plus90.1987.902.2890.07
UHRR_L4NovaSeq X Plus92.3790.082.2990.08
2.2 Quantification and Correlation

The quantification results indicate that the NovaSeq X Plus and NovaSeq 6000 platforms have high similarity in gene expression. The R2 value between the two platforms is >0.97, which is comparable to the R2 value between two lanes in the NovaSeq X Plus.
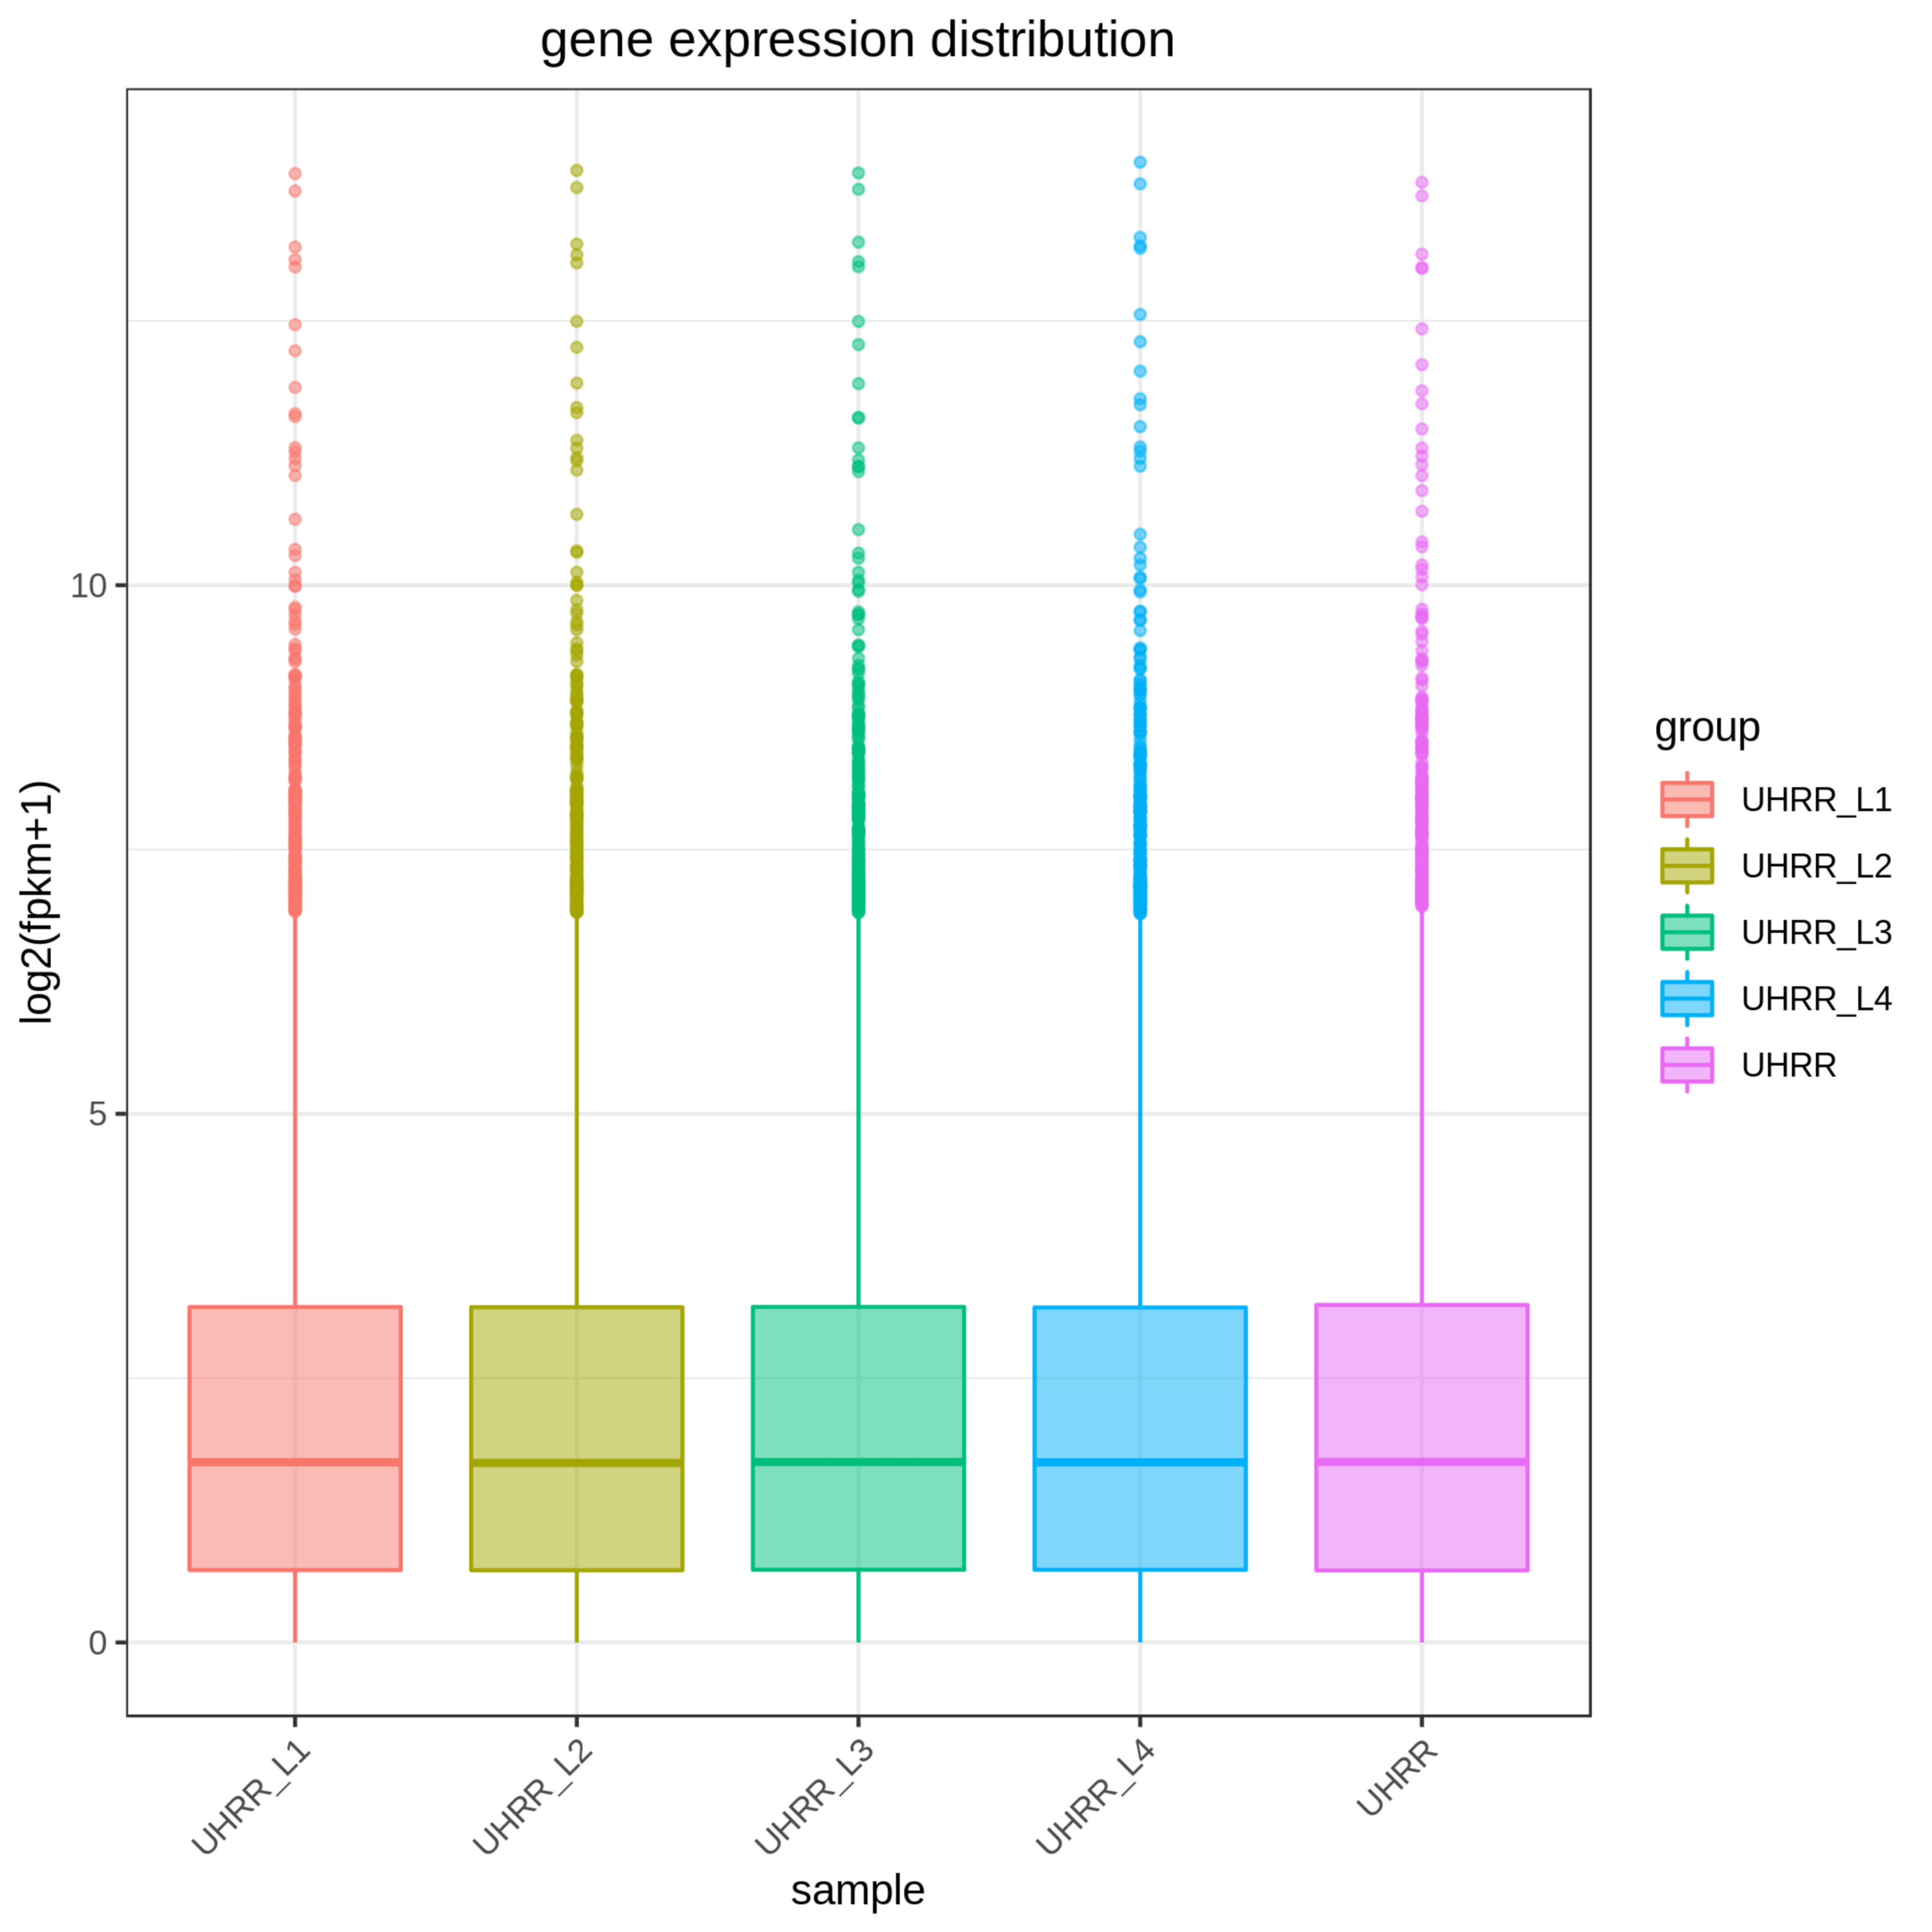
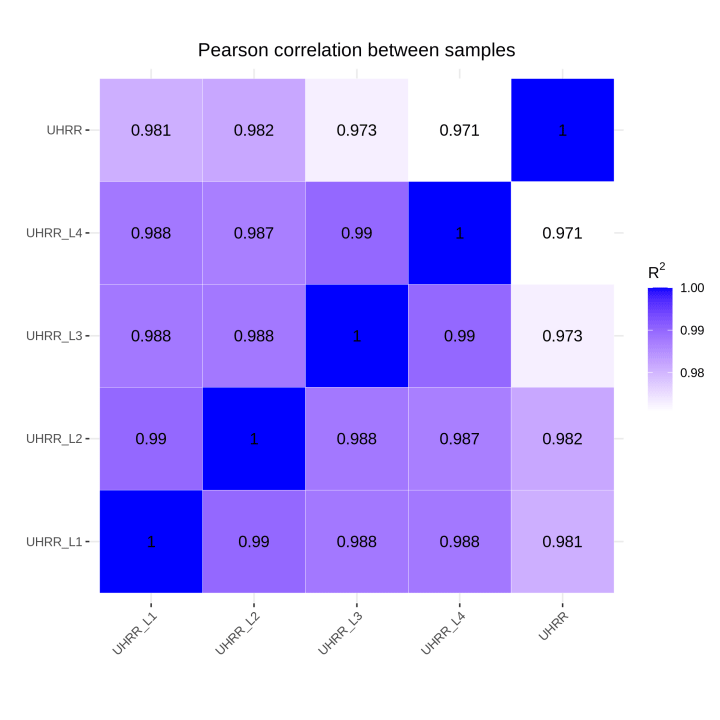
Figure 3 Quantification and correlation features of mRNA sequencing library in NovaSeq X Plus and NovaSeq 6000

3. Testing Result of LncRNA Sequencing Library

LncRNA sequencing library with UHRR was simultaneously sequenced on the NovaSeq X Plus and NovaSeq 6000 to further evaluate the platform performance.

3.1 Quality Control and Mapping Statistics

When compared to the NovaSeq 6000, the effective rate, Q30 and rRNA rate of the LncRNA sequencing library on the NovaSeq X Plus showed almost identical results, with <1% deviation.

Table 6 Quality control of lncRNA sequencing library
SamplePlatformEffective (%)Error rate (%)Q20 (%)Q30 (%)GC (%)rRNA (%)
UHRR_controlNovaSeq 600098.420.0298.1494.6351.170.60
UHRR_Lnc1NovaSeq X Plus97.740.0397.0994.8349.940.29
UHRR_Lnc2NovaSeq X Plus97.580.0397.4995.3749.930.33
UHRR_Lnc3NovaSeq X Plus98.160.0396.8394.6349.200.27
Table 7 Mapping statistics of lncRNA sequencing library
SamplePlatformMapped (%)Unique map (%)Multi map(%)Exon map (%)
UHRR_controlNovaSeq 600096.8393.543.2968.14
UHRR_Lnc1NovaSeq X Plus96.0793.063.0167.20
UHRR_Lnc2NovaSeq X Plus96.2293.093.1267.11
UHRR_Lnc3NovaSeq X Plus94.0891.482.6066.45
3.2 Quantification and Correlation

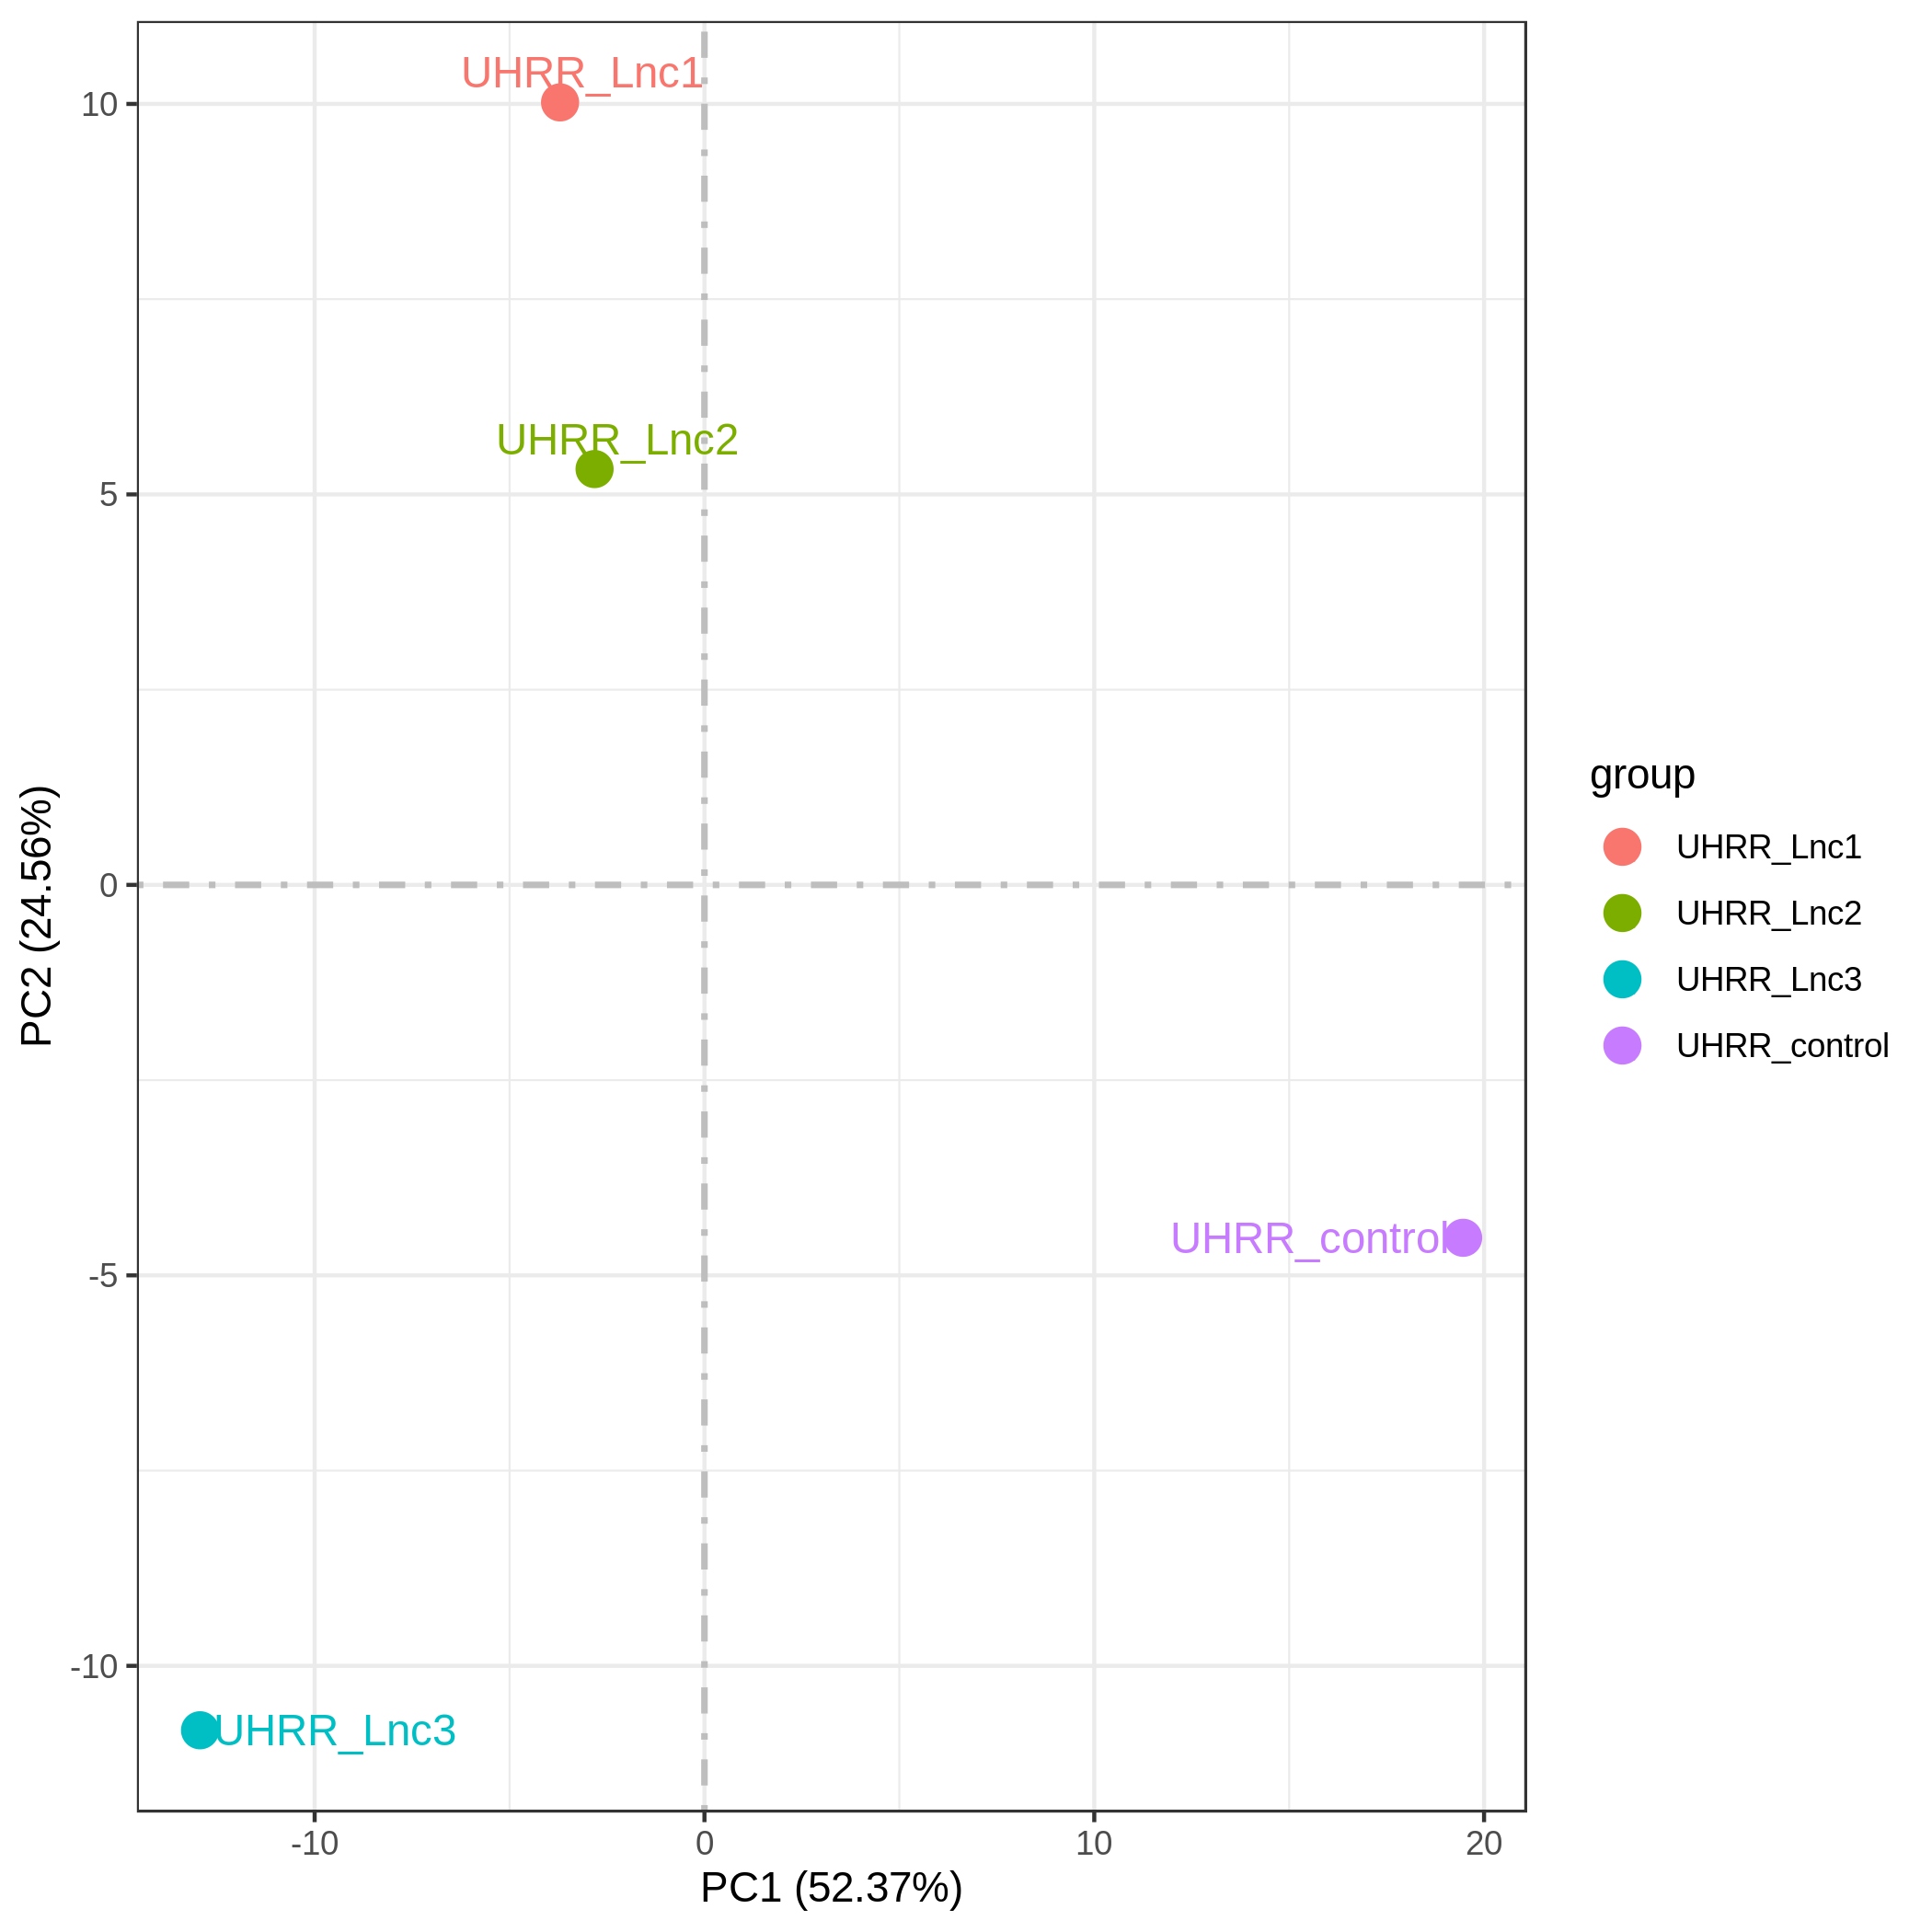
The quantification results indicate that the gene expression similarity between the NovaSeq X Plus and the NovaSeq 6000 is high, with an R2 value >0.96, which is similar to the R2 value between two lanes on the NovaSeq X Plus platform.

Figure 4 Quantification and correlation features of lncRNA sequencing library in NovaSeq X Plus and NovaSeq 6000

In summary, the NovaSeq X Plus platform demonstrates improved data quality and high consistency with the NovaSeq 6000 in whole genome, whole exome, and transcriptome sequencing libraries. With its outstanding performance in data quality, turnaround time, and affordable price, the NovaSeq X Plus is an attractive option for studies related to population genomics, gene function and regulation.

About Novogene

Novogene is a pioneer in applying cutting-edge molecular biology technology and high-performance computing to research in the fields of life science and human health. Our vision is to continue as a global leader in the delivery of genomics services and solutions. With one of the largest sequencing capacities in the world, we utilise our deep scientific knowledge, first-class customer service and unsurpassed data quality to help clients realise their research goals in the rapidly evolving world of genomics. Novogene is committed to become your trusted genomics partner.

Glossary of Terms:
(1) Effective: The percentage of clean reads in all raw reads. (2) Error: The average error rate of all bases on read1 and read2; the error rate of a base is obtained from equation 1. (3) Q20: The percent of bases with phred-scaled quality scores greater than 20. (4) Q30: The percent of bases with phred-scaled quality scores greater than 30. (5) GC content: The percentage of G and C in all bases. (6) Containing N: read pairs in either one read of which more than 10% of bases are uncertain. (7) Low Quality: read pairs in either one read of which the proportion of low-quality bases is over 50%. (8) Adapter Related: read pairs that contain adapter contamination in either one read. (9) Mapped: The number of reads that mapped to the reference genome (percentage). (10) Properly: The number of reads that mapped to the reference genome and within the expected insert size (percentage). (11) PE mapped: The number of pair-end reads that mapped to the reference genome (percentage). (12) Coverage: The coverage in the whole genome. (13) 4X: The coverage in the whole genome when only bases with depth > 4X are considered. (14) 10X: The coverage in the whole genome when only bases with depth > 10X are considered. (15) 20X: The coverage in the whole genome when only bases with depth > 20X are considered. (16) Precision=TP/(TP+FP) (percentage) (17) Recall=TP/(TP+FN) (percentage) (18) F-score=2* Precision*Recall/(Precision + Recall) (19) dbSNP (SNP): The number of SNPs that have been reported in dbSNP database divided by the total number of SNPs. (20) dbSNP (InDel): The number of InDels that have been reported in dbSNP database divided by the total number of InDels. (21) Unique_map: Number and percentage of reads aligned to the unique position of the reference genome (for subsequent quantitative data analysis), unique mapping rate: (uniquely mapped reads)/(total reads)*100. (22) Multi_map: number and percentage of reads aligned to multiple locations in the reference genome, multiple mapping rate: (multiple mapped reads)/(total reads)*100. (23) Error_rate:Average sequencing error rate, which is calculated by Qphred=-10log10(e). (24) Exon: The number of reads aligned to exon regions of the genome and its proportion in clean reads. (25) Exon map: The number of bases aligned to exon regions of the genome and its proportion to the number of bases aligned to the genome.

서비스서비스 menu

고객지원고객지원 menu

기업정보기업정보 menu

서비스
WGSDe novo SeqAmplicon SeqShotgun MetagenomeDM-SeqmRNA-SeqSingle Cell Gene ExpressionVisium HDXenium In SituOlinkUntargeted Metabolomics
고객지원
노보매직CSSFalcon 플랫폼
기업정보
회사소개글로벌 입지플랫폼뉴스룸채용 정보문의하기
LinkedInLinkedIn hoverYouTubeYouTube hoverXX hoverMetaMeta hoverInstagramInstagram hover
Copyright © 2026 Novogene Co., Ltd. All Rights Reserved. 노보진의 한국 내 모든 서비스는 연구 목적 (Research Use Only, RUO) 으로만 제공됩니다. 사업자등록번호: 494-86-03792 | 판매자번호: 노보진코리아유한회사 | 대표자명: 리휘시앙 | 사업자주소: 서울시 강서구 마곡동 779-1번지 뉴브클라우드힐스 BT-230, 231호, 07790 | 전화번호: 02-2038-8036
Novogene Korea
  • Novogene Korea
  • Genomics
    • Human Whole Genome Sequencing
    • Plant & Animal Whole Genome Sequencing
    • Microbial Whole Genome Sequencing
    • Whole Exome Sequencing
    • Plant & Animal De novo Sequencing
    • Microbial De novo Sequencing
    • Amplicon Sequencing
    • Shotgun Metagenomics Sequencing
    Transcriptomics
    • mRNA Sequencing
    • Total RNA Sequencing
    • Full-Length Transcriptome Sequencing
    • Whole Transcriptome Sequencing
    • Small RNA Sequencing
    • Circular RNA Sequencing
    • Metatranscriptome Sequencing
    • Prokaryotic RNA Sequencing
    Single Cell & Spatial Omics
    • Single Cell Gene Expression
    • Single Cell Immune Profiling Sequencing
    • Single Cell Long Read Transcriptome
    • Visium HD Spatial Gene Expression
    • Stereo-Seq Spatial Gene Expression
    • Xenium In Situ Spatial Transcriptome
    Epigenomics
    • Whole Genome Bisulfite Sequencing (WGBS)
    • Directed DNA Methylation Sequencing (DM-Seq) NEW
    • Reduced Representation Bisulfite Sequencing (RRBS)
    • Chromatin Immunoprecipitation Sequencing (ChIP-seq)
    • RNA Immunoprecipitation Sequencing (RIP-seq)
    • Assay for Transposase-Accessible Chromatin with Sequencing (ATAC-seq)

    Premade Library

    • Sequencing Only (Illumina 플랫폼)
    • Sequencing Only (PacBio 플랫폼)
    Proteomics & Metabolomics
    • Olink Proteomics
    • Quantitative Proteomics (MS)
    • Untargeted Metabolomics (MS)
  • 프로모션프로모션
    • 플랫폼
    • 자동화 운송 플랫폼 (Falcon)
    • BI 분석툴 (NovoMagic)
    • Customer Service System (CSS)
    • 브로셔
    • 케이스 스터디
    • 웨비나
    • 블로그
    • 샘플준비 가이드라인
    • 커뮤니티
    • 암 연구
    • 면역 종양학
    • 농업
    • 환경
    • 식품
    • 인간 마이크로바이옴
    • 동물 & 식물 마이크로바이옴
    • 신약개발
    • 희귀 질환 연구
    • 회사소개
    • 글로벌 입지
    • 뉴스룸
    • 채용 정보
  • 문의하기문의하기
  1. Home
  2. Company
  3. Shared SNP percentage >96% in exome library data and quantification correlation >97% in transcriptome library data - NovaSeq X Plus new data release

Shared SNP percentage >96% in exome library data and quantification correlation >97% in transcriptome library data - NovaSeq X Plus new data release

The NovaSeq X Plus platform provides extraordinary sequencing power not only for whole genome sequencing but also for whole exome sequencing and transcriptome sequencing. Following the previous release of human whole genome sequencing test on the NovaSeq X Plus, data from more library types are now available.

1. Testing Result of Human Whole Exome Sequencing Library

To further evaluate the platform’s performance, a whole exome sequencing library with NA12878 was simultaneously sequenced on both the NovaSeq X Plus and NovaSeq 6000 platforms. The library was prepared using Agilent SureSelect Human All Exon V6.

1.1 Quality Control

Compared with the NovaSeq 6000, the NovaSeq X Plus platform performs better in Q30, with an average of 95.70%.

Table 1 Quality control of whole exome sequencing library
SamplePlatformEffective (%)Error (%)Q20 (%)Q30 (%)GC (%)Containing N (%)Low quality (%)Adapter related (%)
S_WNovaSeq 600097.880.0298.3195.1951.970.000.002.11
S_FC1_WL1XNovaSeq X Plus97.190.0397.5995.7351.260.010.002.8
S_FC1_WL2XNovaSeq X Plus97.000.0297.8796.1351.260.010.002.99
S_FC2_WL1XNovaSeq X Plus97.830.0397.2395.5650.580.000.002.17
S_FC2_WL2XNovaSeq X Plus97.730.0397.2195.3750.660.000.002.27
1.2 Mapping Statistics

The NovaSeq X Plus achieves even coverage across the entire exome, with coverage of 99.5% and capture efficiency of 67.6%.

Table 2 Mapping statistics of whole exome sequencing library
SamplePlatformMapped (%)Properly (%)PE (%)Coverage (%)4X (%)10X (%)20X (%)
S_WNovaSeq 600099.9498.9899.9099.5099.1098.0095.10
S_FC1_WL1XNovaSeq X Plus99.9299.1699.8999.5099.0097.7094.70
S_FC1_WL2XNovaSeq X Plus99.9199.1699.8899.5099.0097.7094.60
S_FC2_WL1XNovaSeq X Plus99.9299.1599.8999.5099.0097.7094.70
S_FC2_WL2XNovaSeq X Plus99.9199.1399.8799.5099.0097.7094.70
Figure 1 Capture efficiency in NovaSeq X Plus and NovaSeq 6000
1.3 Variant Calling Accuracy

The NovaSeq X Plus and NovaSeq 6000 platforms have >96% similarity in SNP detection. The SNP and InDel precision and recall deviation between the two platforms is <0.5%.

Table 3 Variant calling result of whole exome sequencing library
SamplePlatformdbSNP (SNP) (%)dbSNP (InDel)(%)Precision (SNP) (%)Recall (SNP) (%)F-score (SNP) (%)Precision (InDel) (%)Recall (InDel) (%)F-score (InDel) (%)
S_WNovaSeq 600094.0286.3699.0596.8197.9289.4389.2889.35
S_FC1_WL1XNovaSeq X Plus94.3486.9598.9296.6797.7988.8189.6289.21
S_FC1_WL2XNovaSeq X Plus93.9486.3998.8796.7197.7888.7890.3989.58
S_FC2_WL1XNovaSeq X Plus94.7287.7098.9096.4897.6788.8689.1989.03
S_FC2_WL2XNovaSeq X Plus94.6987.3498.8196.5697.6788.5889.3988.98
Figure 2 Venn diagrams of shared SNPs between NovaSeq X Plus and NovaSeq 6000

2. Testing Result of mRNA Sequencing library

An mRNA sequencing library with UHRR was simultaneously sequenced on both the NovaSeq X Plus and NovaSeq 6000 to further evaluate the platform performance.

2.1 Quality Control and Mapping Statistics

The effective rate, Q30 score, and rRNA rate of NovaSeq X Plus are almost similar to that of NovaSeq 6000, with <1% deviation.

Table 4 Quality control of mRNA sequencing library
SamplePlatformEffective (%)Error rate (%)Q20 (%)Q30 (%)GC (%)rRNA (%)
UHRRNovaSeq 600095.850.0298.2895.0550.152.24
UHRR_L1NovaSeq X Plus94.210.0397.3395.2849.191.48
UHRR_L2NovaSeq X Plus93.850.0297.7095.7949.151.24
UHRR_L3NovaSeq X Plus95.540.0397.0795.2548.471.58
UHRR_L4NovaSeq X Plus95.440.0397.0295.0248.551.23
Table 5 Mapping statistics of mRNA sequencing library
SamplePlatformMapped (%)Unique map (%)Multi map (%)Exon (%)
UHRRNovaSeq 600095.7192.852.8690.16
UHRR_L1NovaSeq X Plus94.9092.342.5690.16
UHRR_L2NovaSeq X Plus95.0592.392.6690.13
UHRR_L3NovaSeq X Plus90.1987.902.2890.07
UHRR_L4NovaSeq X Plus92.3790.082.2990.08
2.2 Quantification and Correlation

The quantification results indicate that the NovaSeq X Plus and NovaSeq 6000 platforms have high similarity in gene expression. The R2 value between the two platforms is >0.97, which is comparable to the R2 value between two lanes in the NovaSeq X Plus.
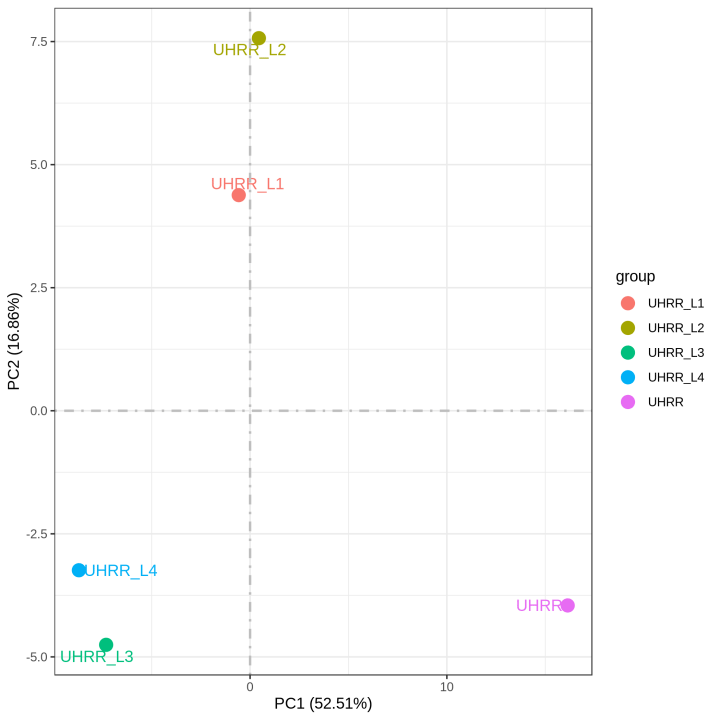
Figure 3 Quantification and correlation features of mRNA sequencing library in NovaSeq X Plus and NovaSeq 6000

3. Testing Result of LncRNA Sequencing Library

LncRNA sequencing library with UHRR was simultaneously sequenced on the NovaSeq X Plus and NovaSeq 6000 to further evaluate the platform performance.

3.1 Quality Control and Mapping Statistics

When compared to the NovaSeq 6000, the effective rate, Q30 and rRNA rate of the LncRNA sequencing library on the NovaSeq X Plus showed almost identical results, with <1% deviation.

Table 6 Quality control of lncRNA sequencing library
SamplePlatformEffective (%)Error rate (%)Q20 (%)Q30 (%)GC (%)rRNA (%)
UHRR_controlNovaSeq 600098.420.0298.1494.6351.170.60
UHRR_Lnc1NovaSeq X Plus97.740.0397.0994.8349.940.29
UHRR_Lnc2NovaSeq X Plus97.580.0397.4995.3749.930.33
UHRR_Lnc3NovaSeq X Plus98.160.0396.8394.6349.200.27
Table 7 Mapping statistics of lncRNA sequencing library
SamplePlatformMapped (%)Unique map (%)Multi map(%)Exon map (%)
UHRR_controlNovaSeq 600096.8393.543.2968.14
UHRR_Lnc1NovaSeq X Plus96.0793.063.0167.20
UHRR_Lnc2NovaSeq X Plus96.2293.093.1267.11
UHRR_Lnc3NovaSeq X Plus94.0891.482.6066.45
3.2 Quantification and Correlation

The quantification results indicate that the gene expression similarity between the NovaSeq X Plus and the NovaSeq 6000 is high, with an R2 value >0.96, which is similar to the R2 value between two lanes on the NovaSeq X Plus platform.
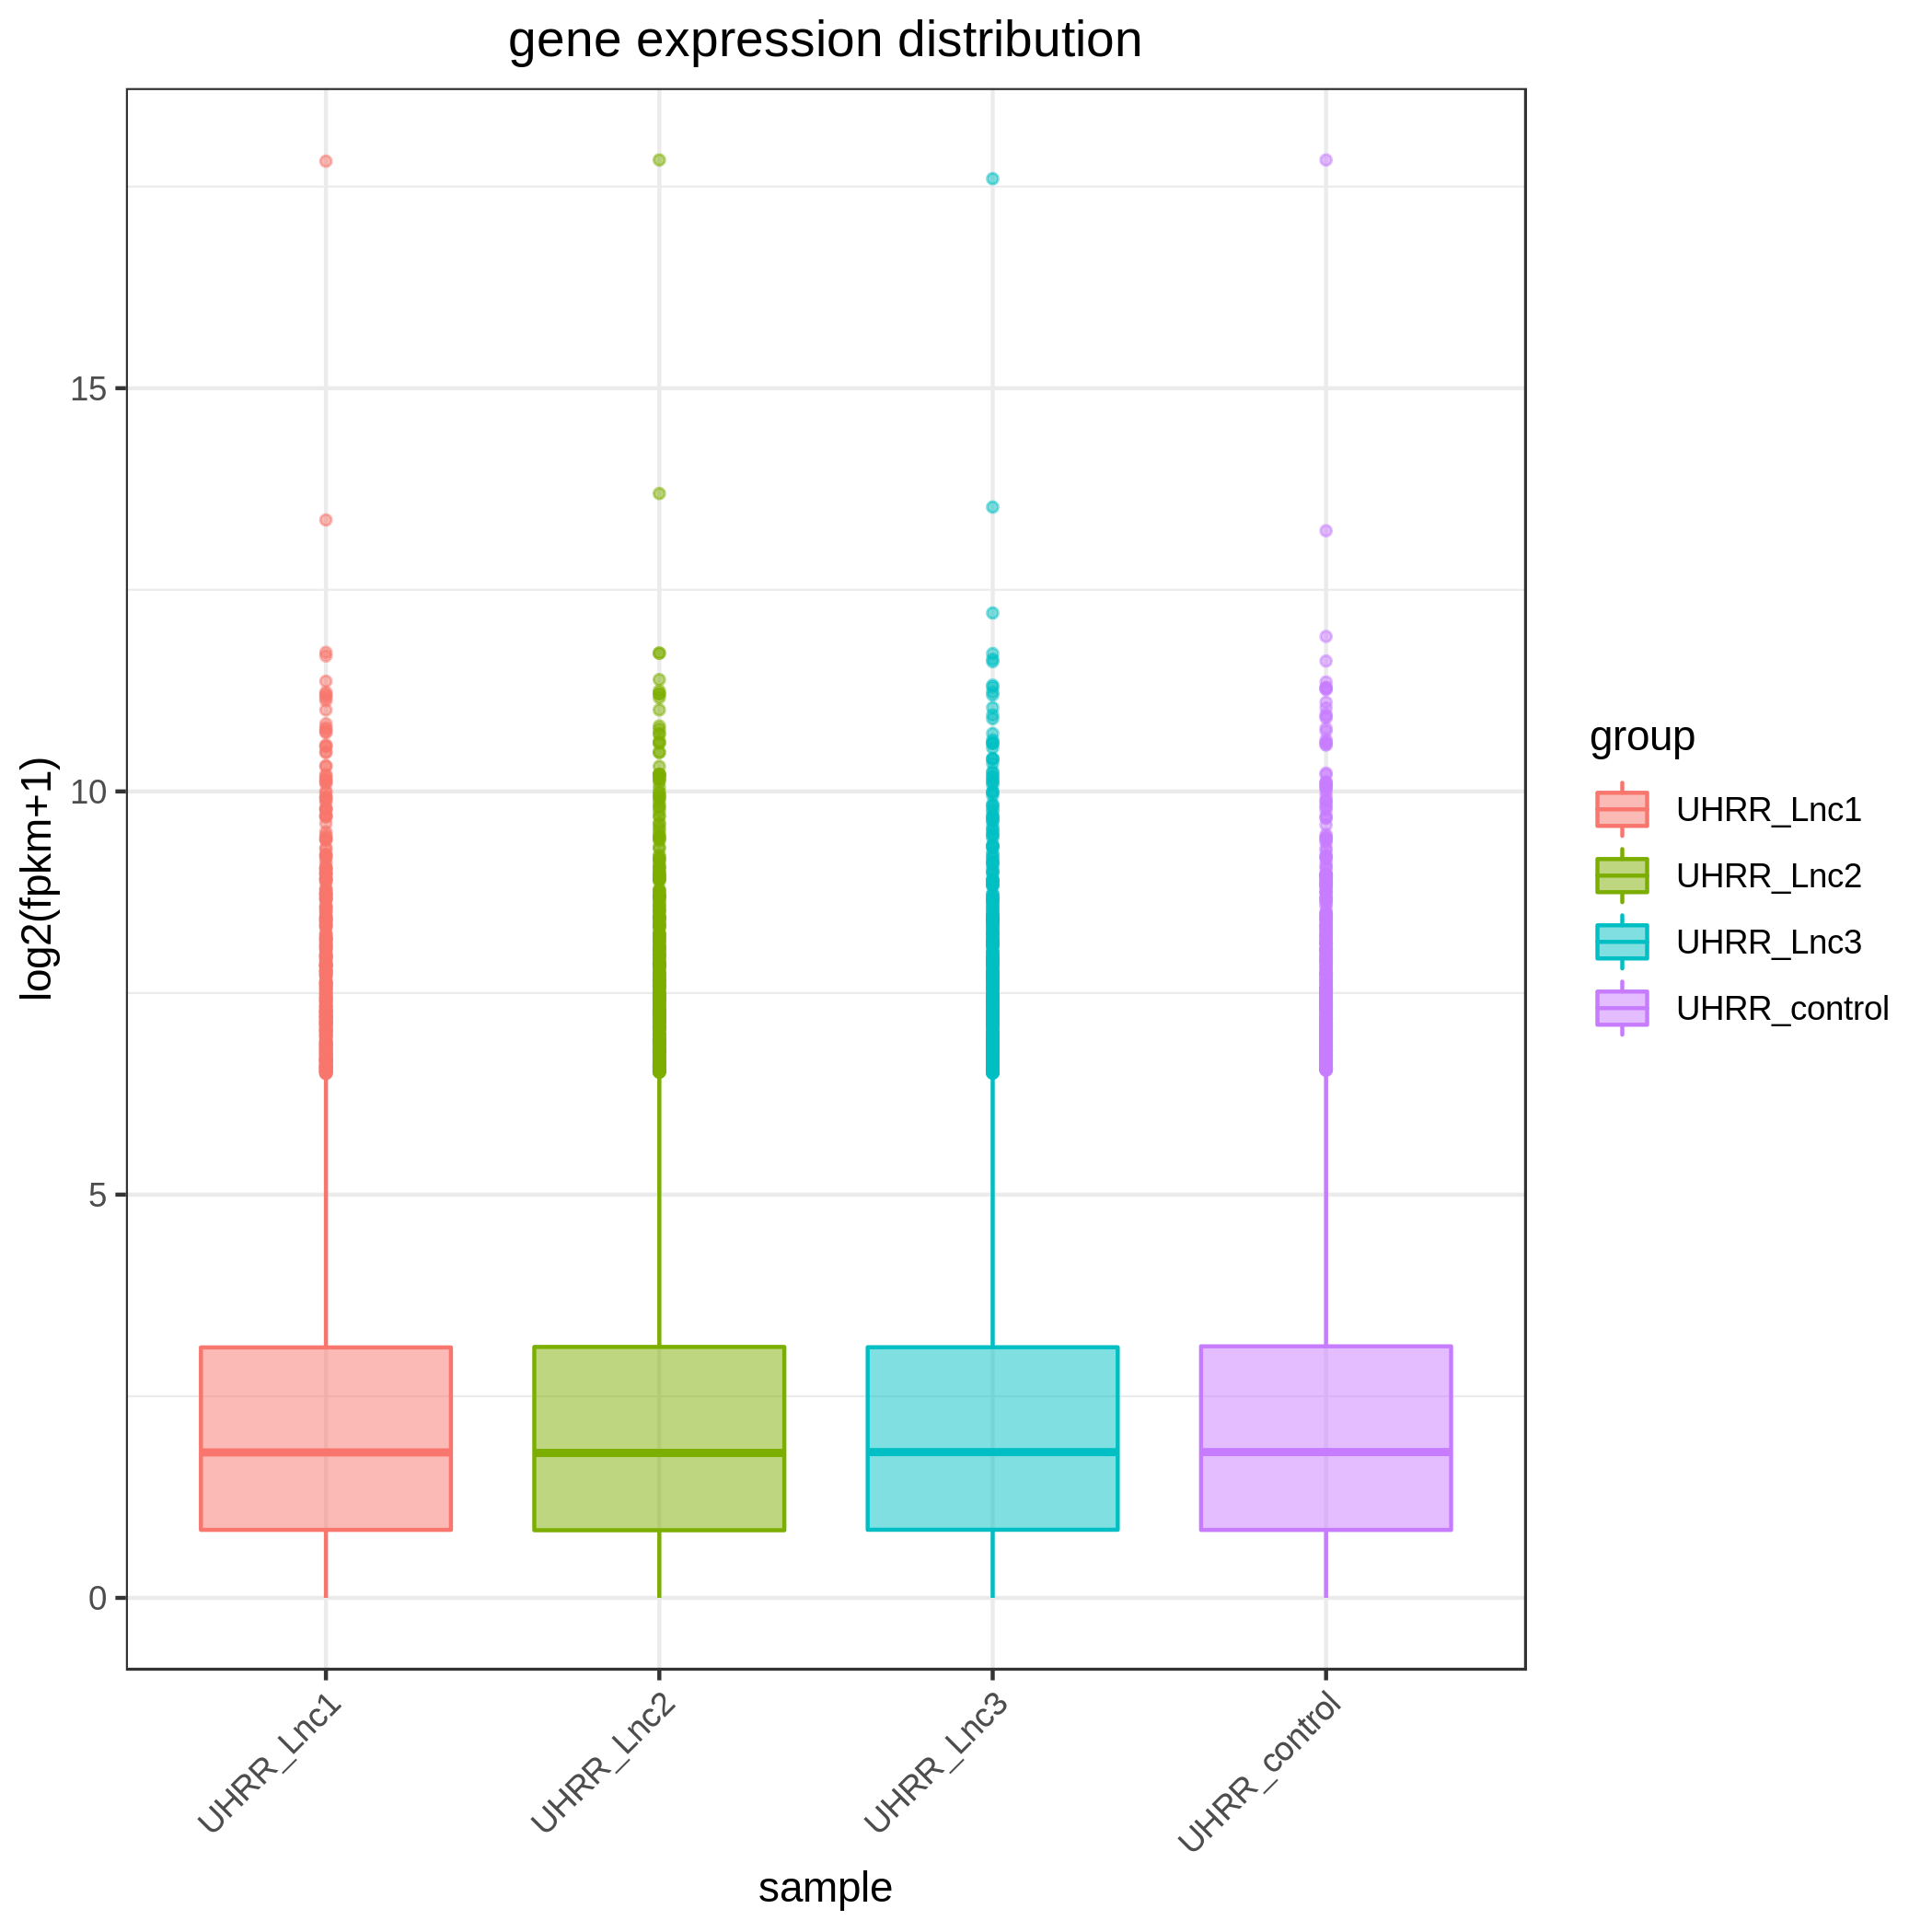
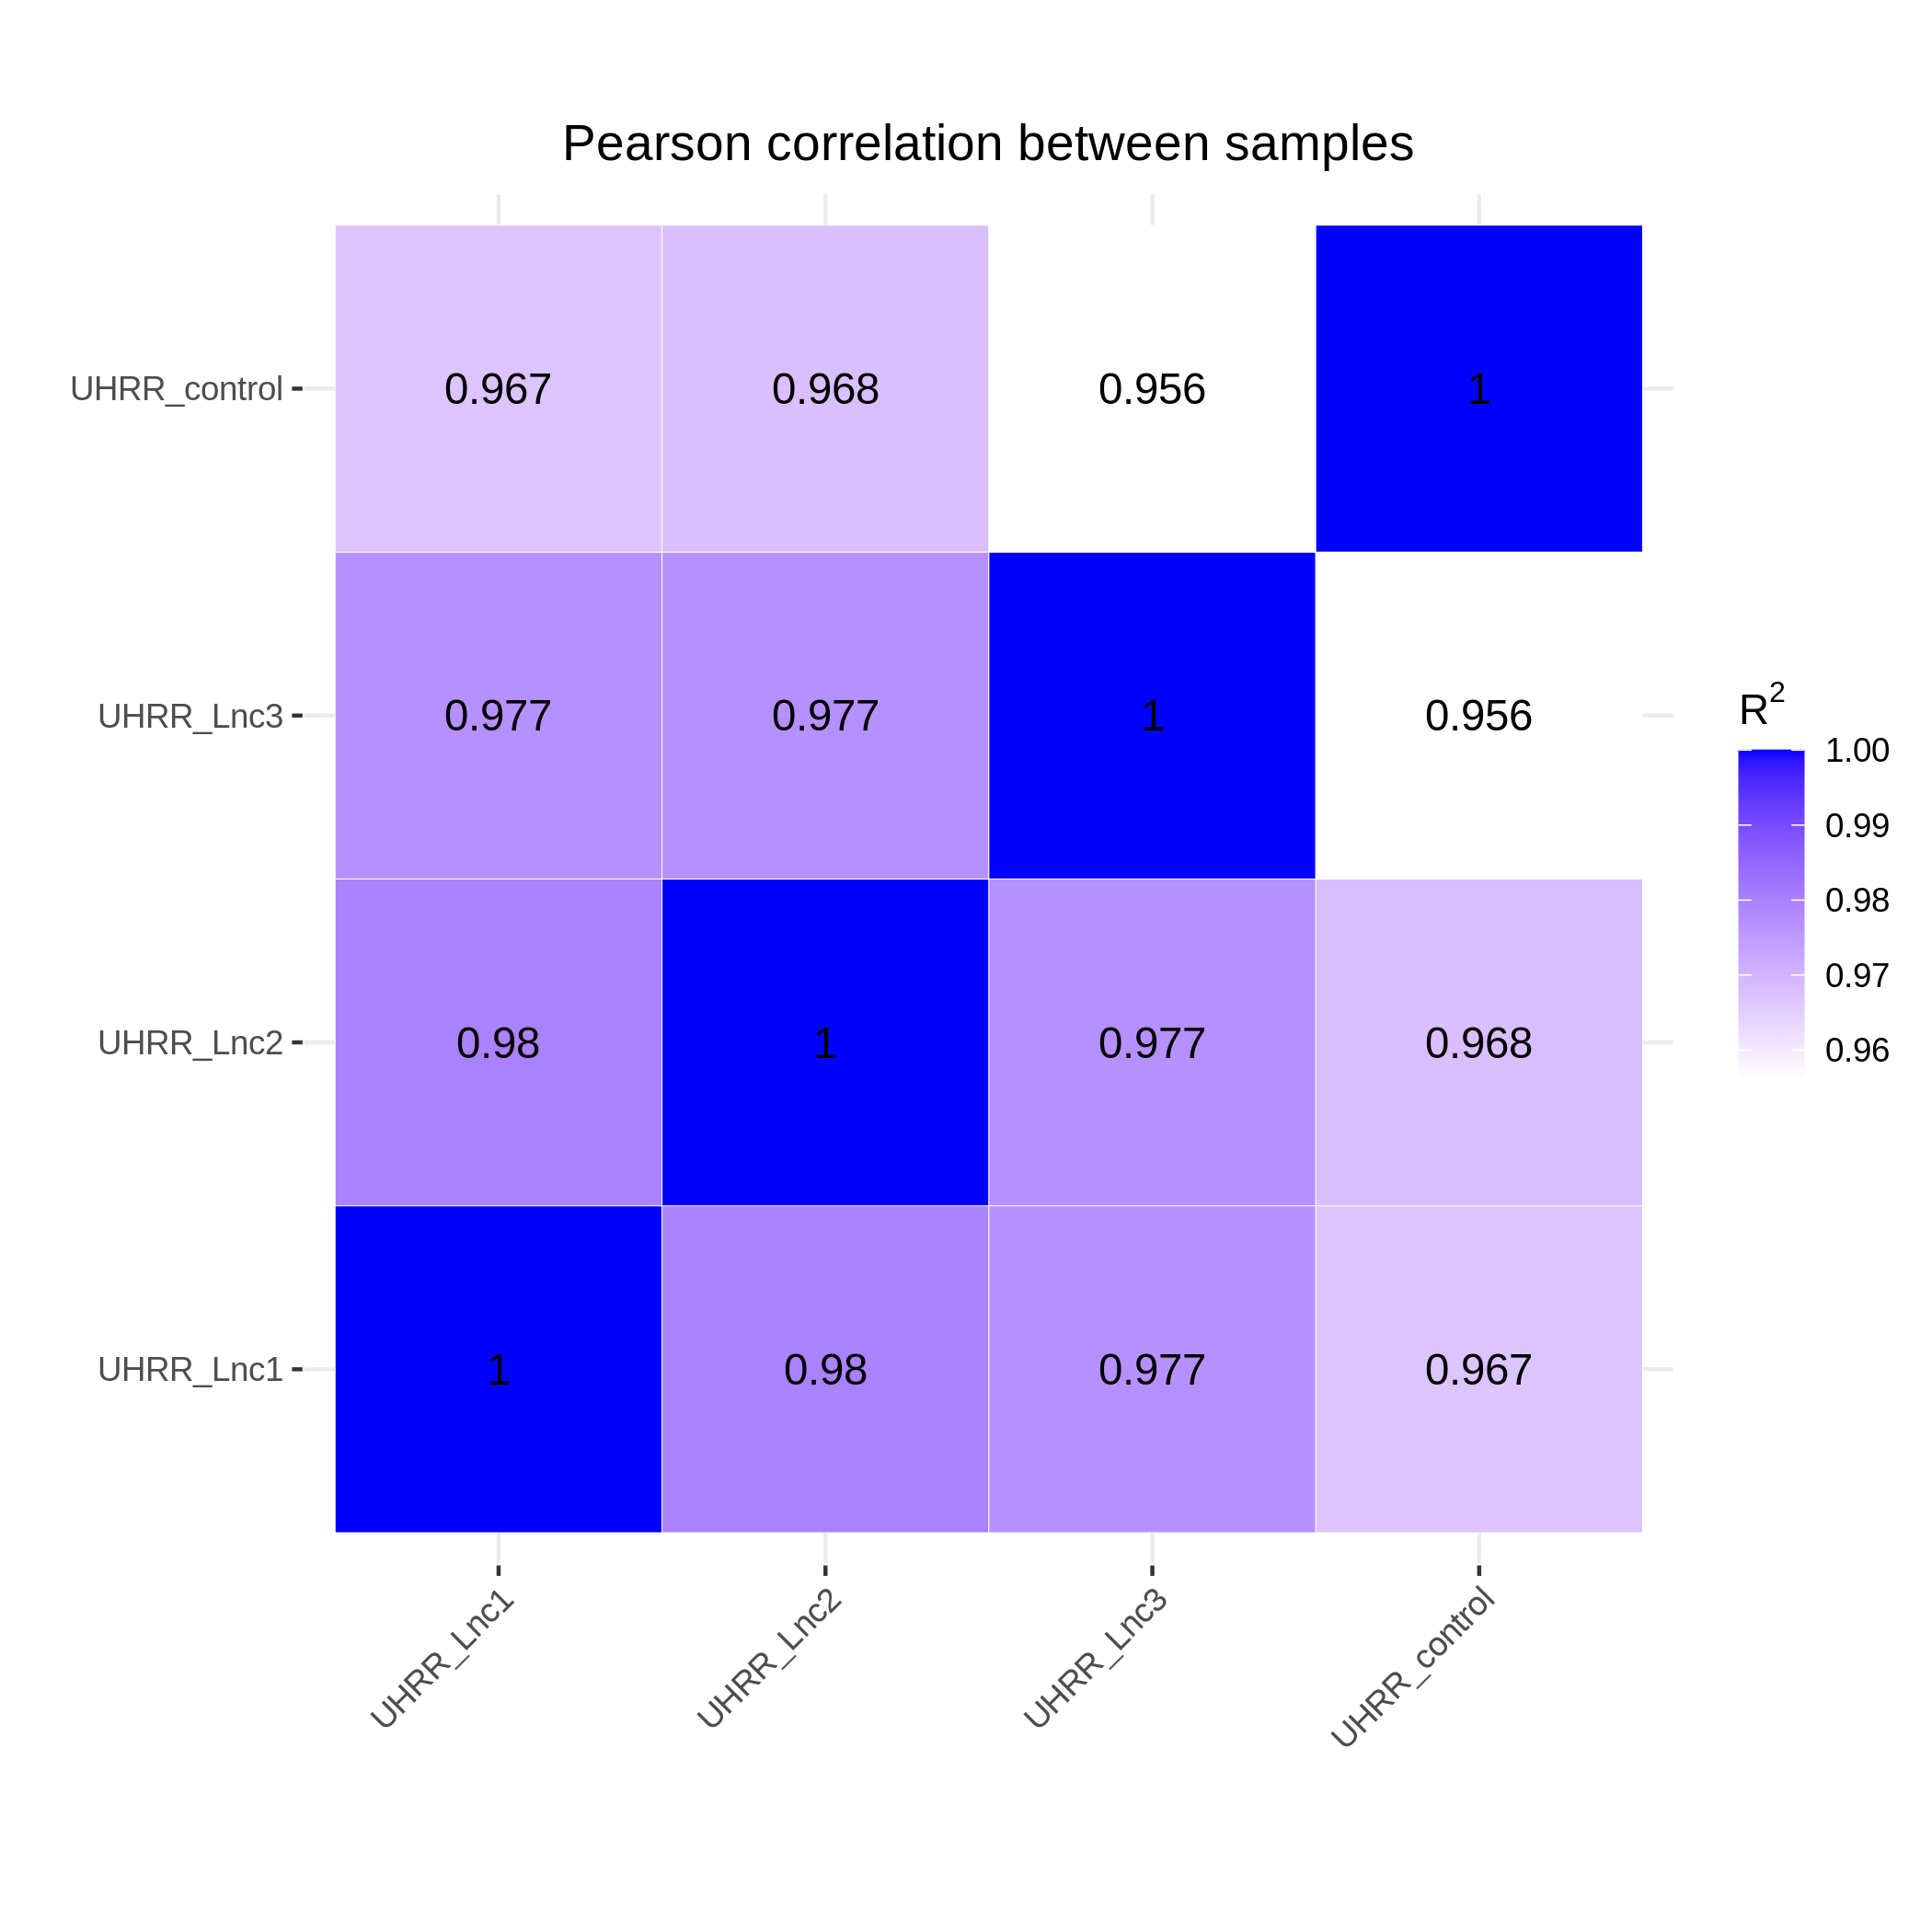
Figure 4 Quantification and correlation features of lncRNA sequencing library in NovaSeq X Plus and NovaSeq 6000

In summary, the NovaSeq X Plus platform demonstrates improved data quality and high consistency with the NovaSeq 6000 in whole genome, whole exome, and transcriptome sequencing libraries. With its outstanding performance in data quality, turnaround time, and affordable price, the NovaSeq X Plus is an attractive option for studies related to population genomics, gene function and regulation.

About Novogene

Novogene is a pioneer in applying cutting-edge molecular biology technology and high-performance computing to research in the fields of life science and human health. Our vision is to continue as a global leader in the delivery of genomics services and solutions. With one of the largest sequencing capacities in the world, we utilise our deep scientific knowledge, first-class customer service and unsurpassed data quality to help clients realise their research goals in the rapidly evolving world of genomics. Novogene is committed to become your trusted genomics partner.

Glossary of Terms:
(1) Effective: The percentage of clean reads in all raw reads. (2) Error: The average error rate of all bases on read1 and read2; the error rate of a base is obtained from equation 1. (3) Q20: The percent of bases with phred-scaled quality scores greater than 20. (4) Q30: The percent of bases with phred-scaled quality scores greater than 30. (5) GC content: The percentage of G and C in all bases. (6) Containing N: read pairs in either one read of which more than 10% of bases are uncertain. (7) Low Quality: read pairs in either one read of which the proportion of low-quality bases is over 50%. (8) Adapter Related: read pairs that contain adapter contamination in either one read. (9) Mapped: The number of reads that mapped to the reference genome (percentage). (10) Properly: The number of reads that mapped to the reference genome and within the expected insert size (percentage). (11) PE mapped: The number of pair-end reads that mapped to the reference genome (percentage). (12) Coverage: The coverage in the whole genome. (13) 4X: The coverage in the whole genome when only bases with depth > 4X are considered. (14) 10X: The coverage in the whole genome when only bases with depth > 10X are considered. (15) 20X: The coverage in the whole genome when only bases with depth > 20X are considered. (16) Precision=TP/(TP+FP) (percentage) (17) Recall=TP/(TP+FN) (percentage) (18) F-score=2* Precision*Recall/(Precision + Recall) (19) dbSNP (SNP): The number of SNPs that have been reported in dbSNP database divided by the total number of SNPs. (20) dbSNP (InDel): The number of InDels that have been reported in dbSNP database divided by the total number of InDels. (21) Unique_map: Number and percentage of reads aligned to the unique position of the reference genome (for subsequent quantitative data analysis), unique mapping rate: (uniquely mapped reads)/(total reads)*100. (22) Multi_map: number and percentage of reads aligned to multiple locations in the reference genome, multiple mapping rate: (multiple mapped reads)/(total reads)*100. (23) Error_rate:Average sequencing error rate, which is calculated by Qphred=-10log10(e). (24) Exon: The number of reads aligned to exon regions of the genome and its proportion in clean reads. (25) Exon map: The number of bases aligned to exon regions of the genome and its proportion to the number of bases aligned to the genome.

서비스서비스 menu

고객지원고객지원 menu

기업정보기업정보 menu

서비스
WGSDe novo SeqAmplicon SeqShotgun MetagenomeDM-SeqmRNA-SeqSingle Cell Gene ExpressionVisium HDXenium In SituOlinkUntargeted Metabolomics
고객지원
노보매직CSSFalcon 플랫폼
기업정보
회사소개글로벌 입지플랫폼뉴스룸채용 정보문의하기
LinkedInLinkedIn hoverYouTubeYouTube hoverXX hoverMetaMeta hoverInstagramInstagram hover
Copyright © 2026 Novogene Co., Ltd. All Rights Reserved. 노보진의 한국 내 모든 서비스는 연구 목적 (Research Use Only, RUO) 으로만 제공됩니다. 사업자등록번호: 494-86-03792 | 판매자번호: 노보진코리아유한회사 | 대표자명: 리휘시앙 | 사업자주소: 서울시 강서구 마곡동 779-1번지 뉴브클라우드힐스 BT-230, 231호, 07790 | 전화번호: 02-2038-8036
Privacy PolicyCookie Policy